🌍 Public
Twitter Sentiment on Climate Change
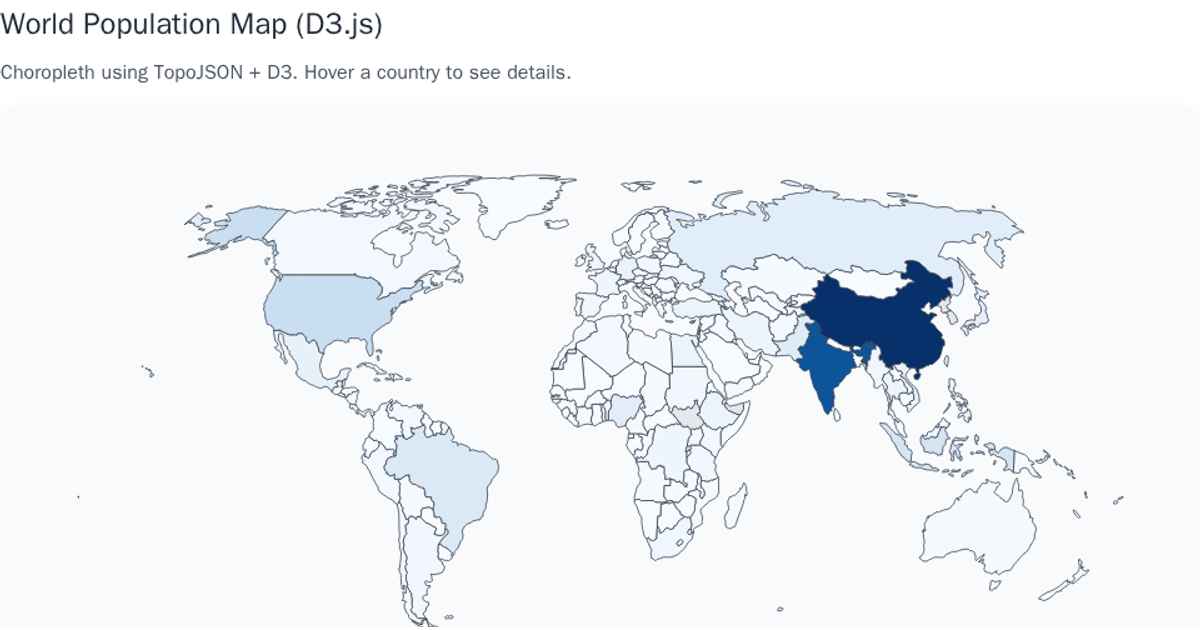
A choropleth-style world map displays country-level population estimates, with semi-transparent teal circles sized by population and drawn at each country’s geographic centroid via `d3.geoPath`, `geoCentroid`, and `geoNaturalEarth1`. A size legend using `scaleSqrt` and a custom `sizeLegend` component conveys population magnitudes, while a color legend from `colorLegend.js` appears unused. The map loads Twitter sentiment data from a CSV and world boundaries from TopoJSON, supporting zoom via `d3.zoom`. Countries with missing data render in a darker fill, and hovering highlights them with a teal fill.
AI-generated descriptionTrying to visualize sentiment of Tweets about Climate Change
MIT Licensed




Comments
Sign in to join the discussion.