🌍 Public
Choropleth Map
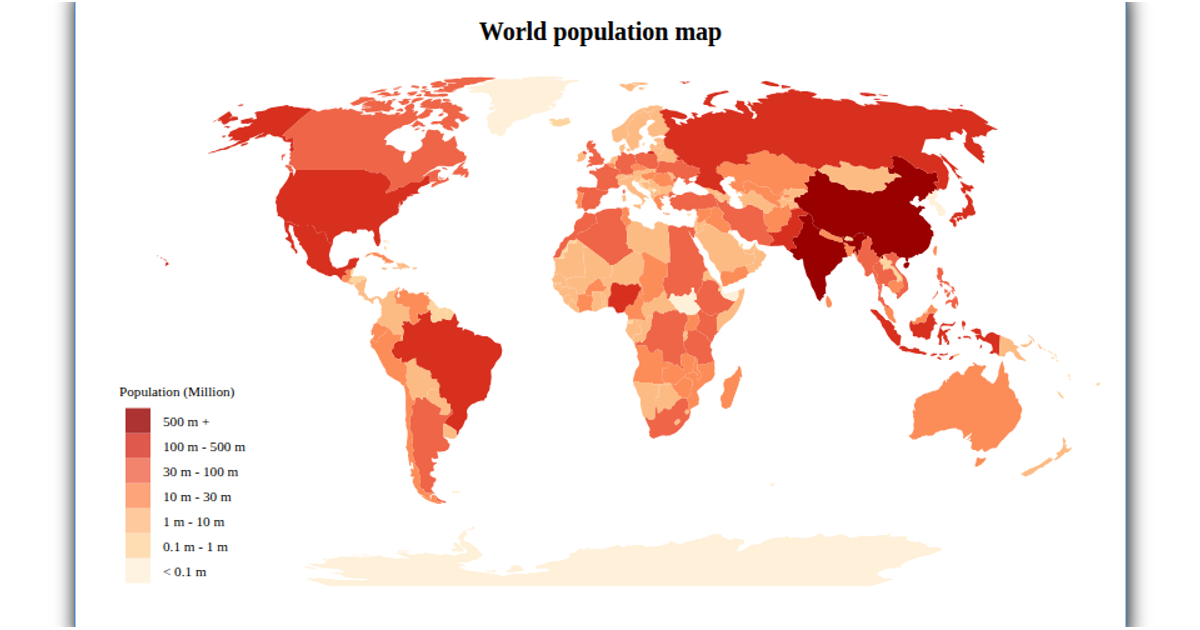
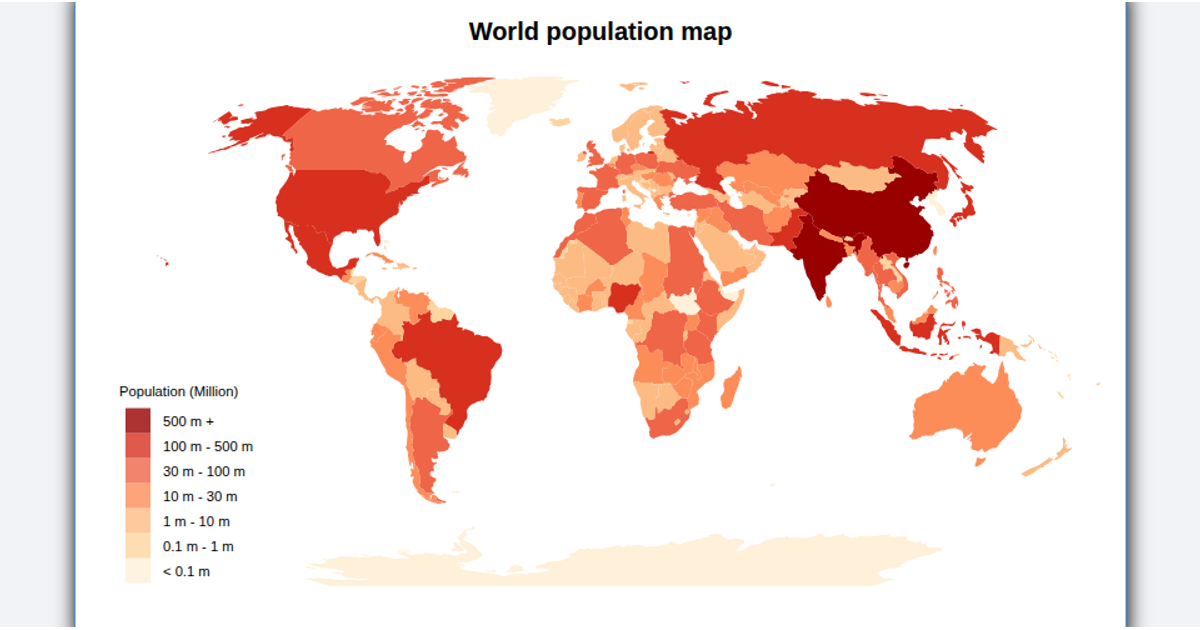
A choropleth map visualizes population estimates per country for 2018, with each country shaded and overlaid with proportional circles sized by population magnitude. The visualization uses a natural Earth projection via `d3.geoPath` and `geoNaturalEarth1`, while `topojson.feature` loads world geometry. Population data comes from a CSV file, and a square-root scale sizes the circles. The map supports zooming through `d3.zoom`, and legends for color and size are built with custom SVG components. Hovering highlights countries and shows population in a tooltip.
AI-generated descriptionMIT Licensed




Comments
Sign in to join the discussion.