🌍 Public
Choropleth Map
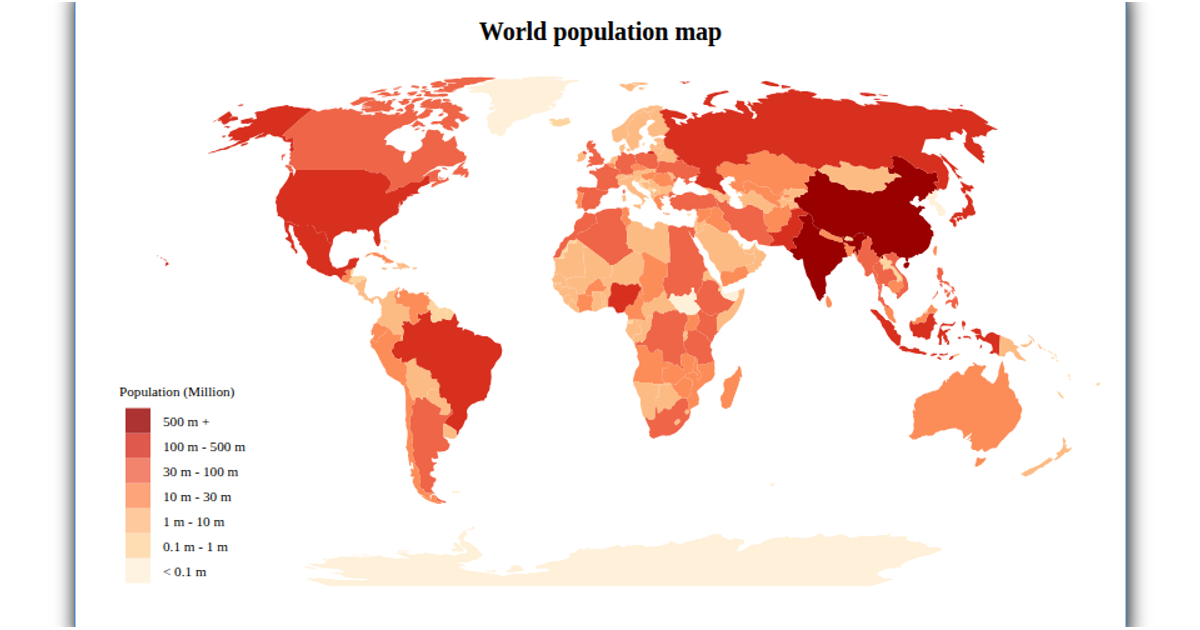
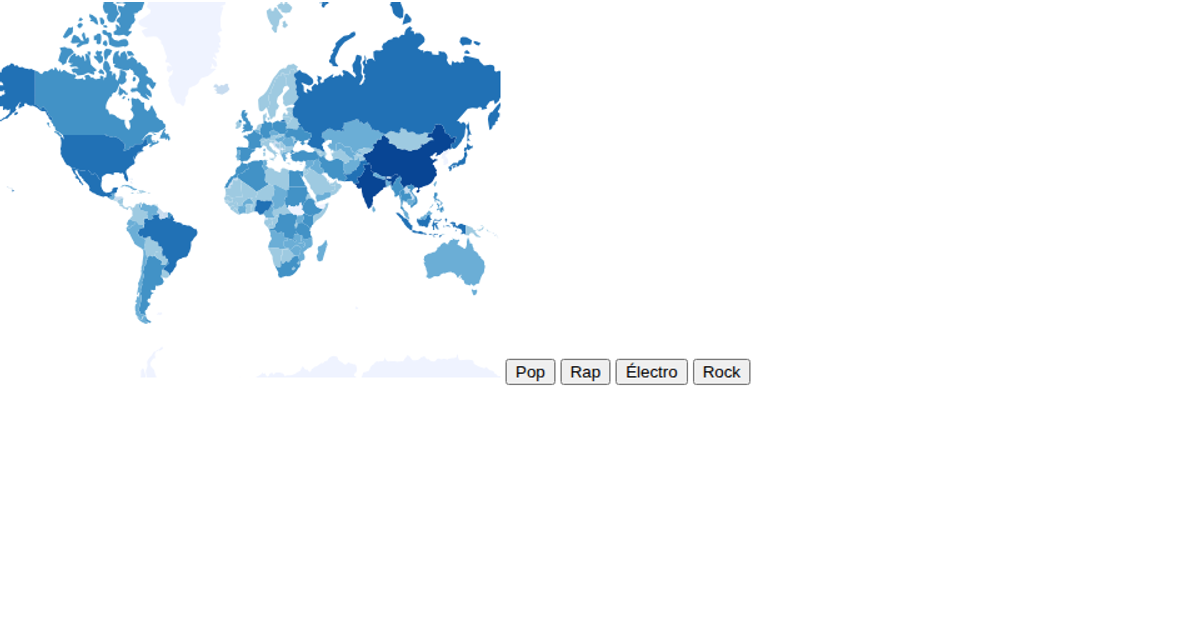
This choropleth map displays global population estimates for 2018, with countries colored in a blue scale on an orthographic projection of the world. The visualization uses `d3.geoOrthographic` to project countries and `d3.geoPath` to render their shapes, while a `d3.scaleSqrt` encodes population counts as circle radii for select countries. Data comes from the UN population estimates CSV and a world TopoJSON, processed with `topojson.feature`. Interactivity includes zooming via `d3.zoom` and a color legend, rendered as SVG.
AI-generated descriptionMIT Licensed



Comments
Sign in to join the discussion.