🌍 Public
Choropleth Map
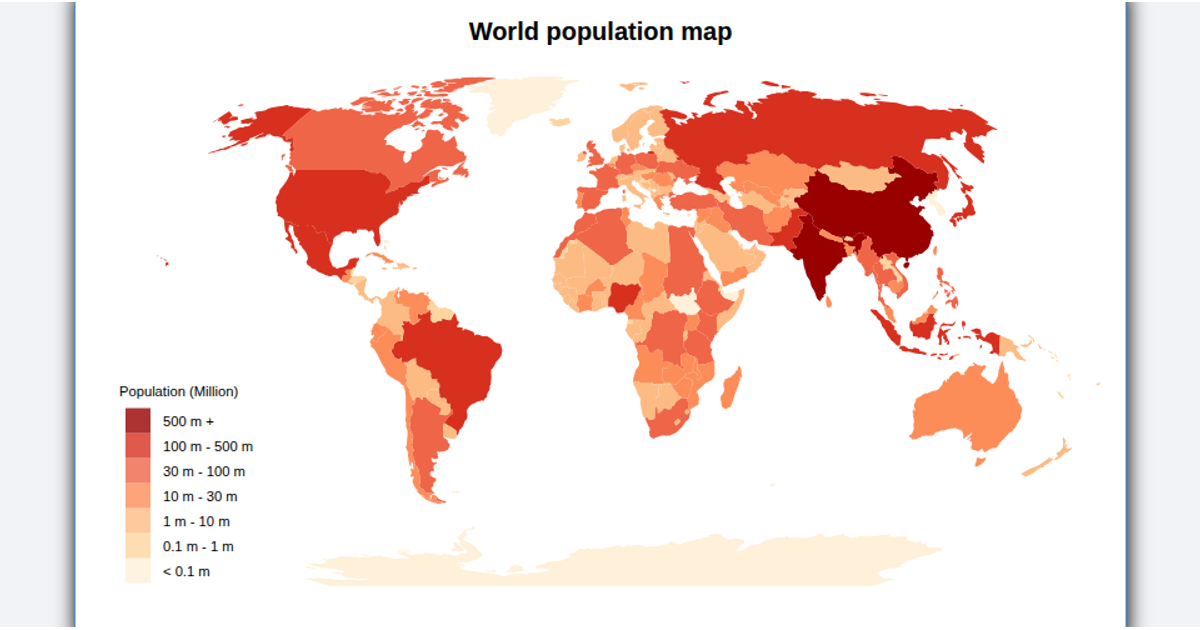
This choropleth map displays global population data from the UN’s 2019 dataset, coloring each country according to its population value. The visualization uses D3’s geoMercator projection and geoPath to render country outlines from World Atlas TopoJSON data, while the D3 scaleOrdinal and schemeSpectral functions generate the color scale. A custom color legend shows the mapping between colors and population values, and hovering over a country highlights it in red.
AI-generated descriptionMIT Licensed


Comments
Sign in to join the discussion.