🌍 Public
Circles on a Map
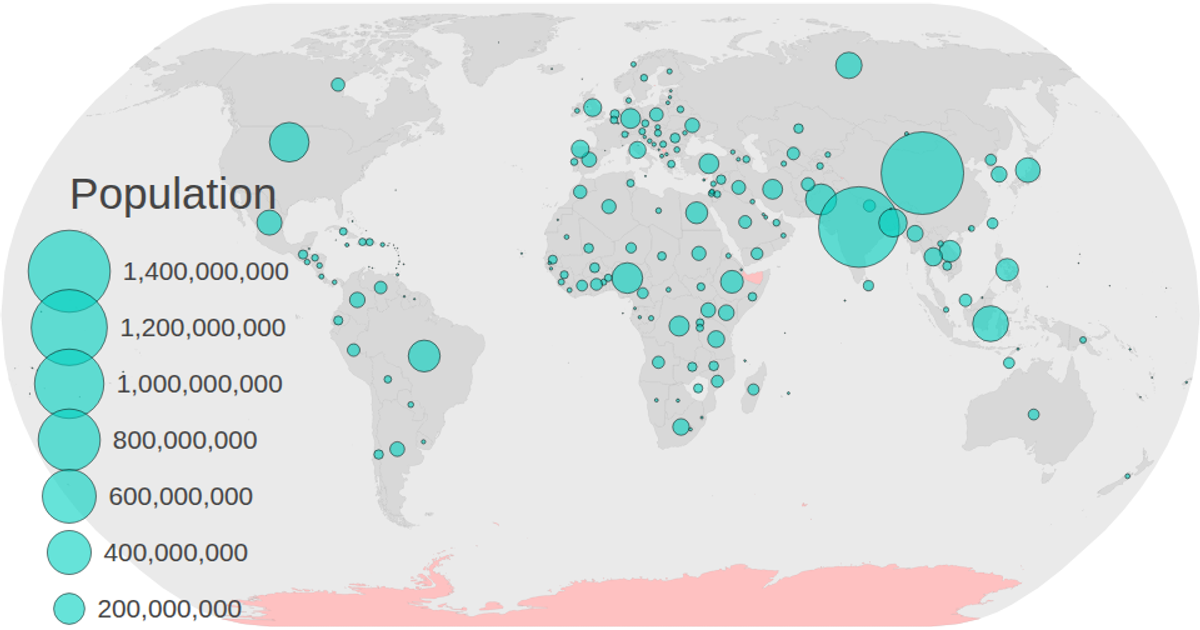
This interactive map displays global population data using proportional circles positioned over each country’s centroid, with a color-coded legend for categories and a size legend for population values. Built with D3 v5, it renders world geography via `d3.geoPath` and a Natural Earth projection, while applying `d3.zoom` for panning. Population values from a CSV are joined to TopoJSON features, and `d3.scaleSqrt` determines circle radii, with tooltips showing region names and formatted numbers. SVG elements and transitions animate legend updates.
AI-generated descriptionInteractive map based off of World Atlas JSON. With population data
MIT Licensed


Comments
Sign in to join the discussion.