🌍 Public
Fork of Choroplath Map with Interactive Filtering
EErik Gimbergsson
Last edited Feb 23, 2021
Created on Feb 23, 2021
Forked from Choroplath Map with Interactive Filtering
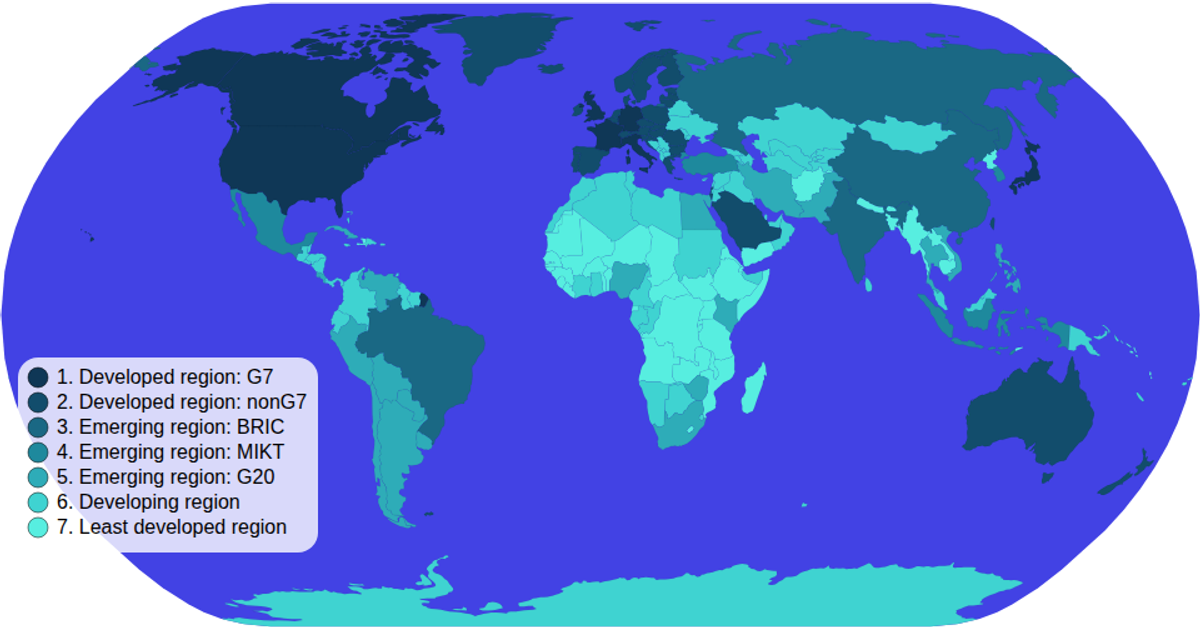
A choropleth map of world countries colored by economic development category, using D3 v5 with an SVG rendering and a natural Earth projection. Users can click legend items to filter and highlight countries matching the selected development group, with non-matching countries faded to low opacity. The visualization loads geographic data from the World Atlas TopoJSON and joins it with TSV metadata, implementing interactive zooming via `d3.zoom` and user-controlled selection through a custom color legend with `d3.scaleOrdinal`.
AI-generated descriptionMIT Licensed


Comments
Sign in to join the discussion.