🌍 Public
Fork of Choropleth Map with Interactive Filtering
CClara Hu
Last edited Mar 24, 2021
Created on Mar 24, 2021
Forked from Choropleth Map with Interactive Filtering
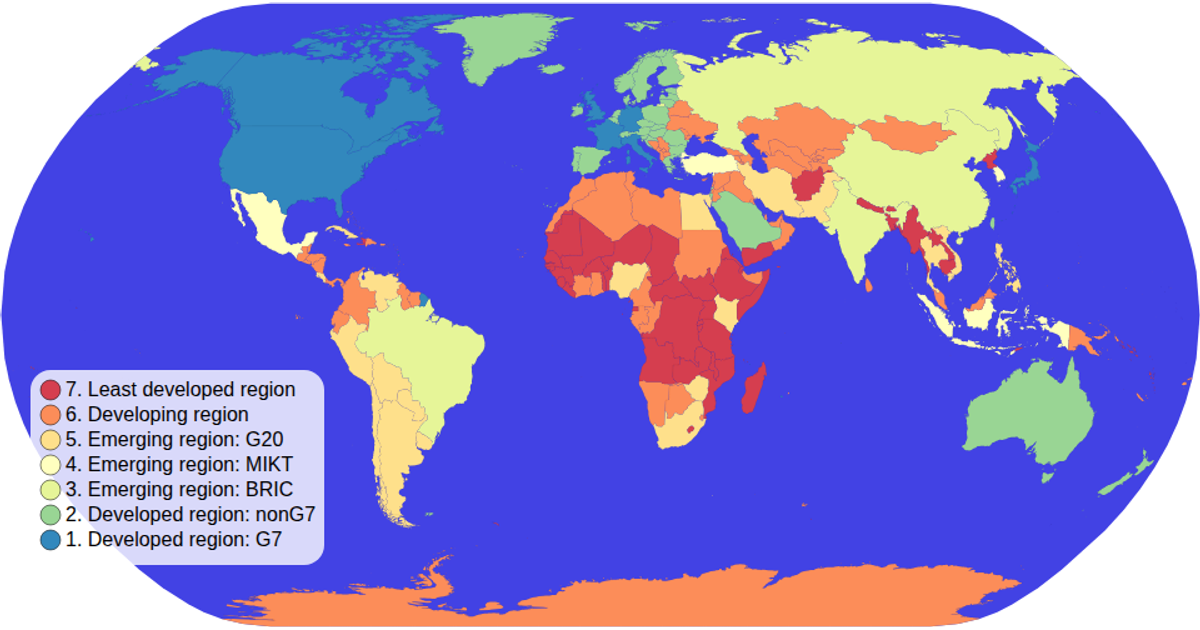
This interactive choropleth map displays the world’s countries colored by their economic classification, with a color legend that filters the map when clicked. Clicking a legend value highlights corresponding countries and dims all others; clicking again clears the filter. Hovering a country reveals its name and value in a tooltip. Built with D3 v5, it uses `d3.geoNaturalEarth1` for projection, `d3.geoPath` to render country paths, and a custom `colorLegend` module for the clickable legend. Data comes from the world-atlas TopoJSON and TSV files, rendered as SVG.
AI-generated descriptionA choropleth map where you can hover over items in the color legend items to interactively filter!
MIT Licensed


Comments
Sign in to join the discussion.