🌍 Public
Fork of Choroplath Map with Interactive Filtering
AAndres de la Garza
Last edited Mar 26, 2021
Created on Mar 26, 2021
Forked from Choroplath Map with Interactive Filtering
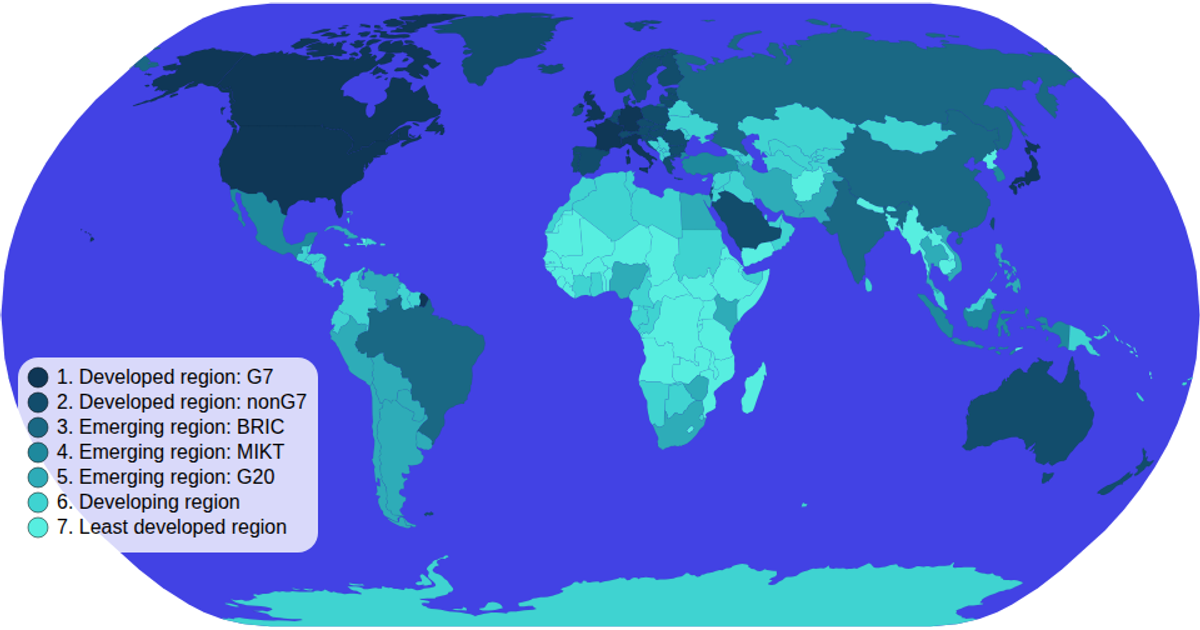
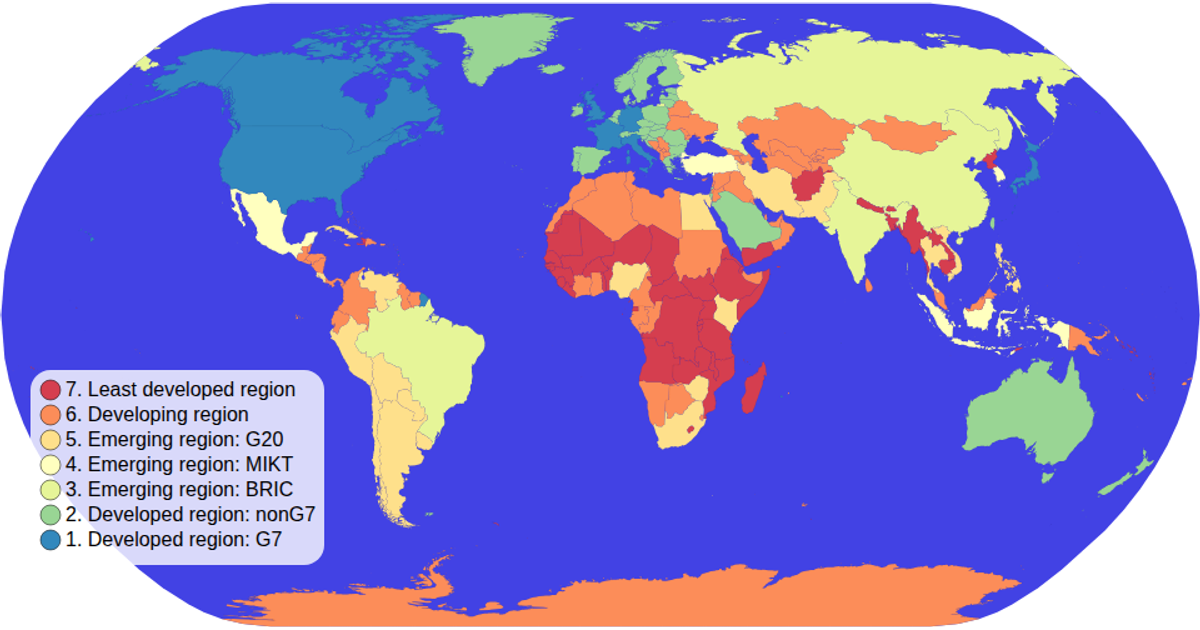
This interactive choropleth map colors countries by economic classification using a categorical color scale and topojson data from the World Atlas. Users click the color legend to filter the map, which dims non-matching countries and highlights the selected category via the `onClick` handler. Pan and zoom are enabled with `d3.zoom` and `d3.geoNaturalEarth1` projection for the SVG paths. The legend and map communicate through a shared `selectedColorValue` state, with opacity transitions driven by the color scale.
AI-generated descriptionMIT Licensed





Comments
Sign in to join the discussion.