🌍 Public
Coropleth Map
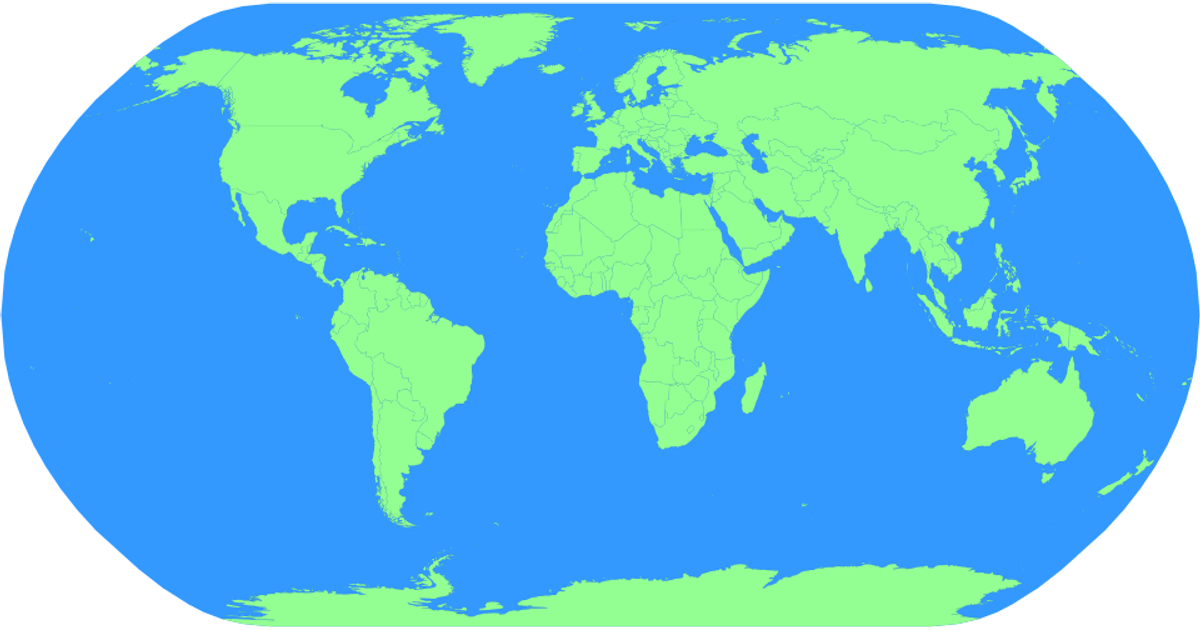
This choropleth map displays world countries as light green shapes on a blue sphere, with red hover highlighting and zoom/pan interaction. It uses D3 v5's `geoNaturalEarth1` projection and `geoPath` to render TopoJSON country boundaries from the world-atlas dataset, while `d3.zoom` enables interactive transformation of the SVG group. Country names are loaded from a TSV file and bound to each path as tooltips via `append('title')`, with the sphere filled through a static path generator.
AI-generated descriptionMIT Licensed



Comments
Sign in to join the discussion.