🌍 Public
choropleth!
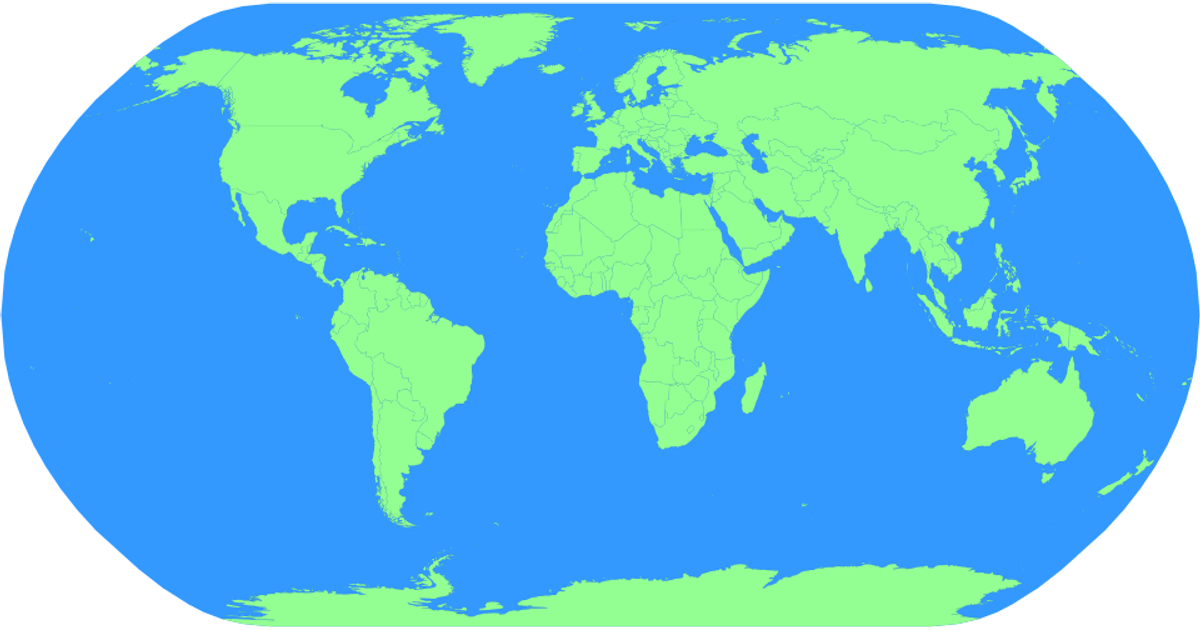
This choropleth displays a world map rendered with a natural Earth projection, coloring countries in light green against a blue sphere. Built with D3 v5 and TopoJSON, it loads country boundaries from the world-atlas dataset and draws them as SVG paths using d3.geoPath. Interactive zooming is enabled through d3.zoom, and hovering over any country turns it red. Each country path includes a title element showing its name, though the display of that name is not implemented.
AI-generated descriptionMIT Licensed







Comments
Sign in to join the discussion.