🌍 Public
Fork of ICE 08 11540905
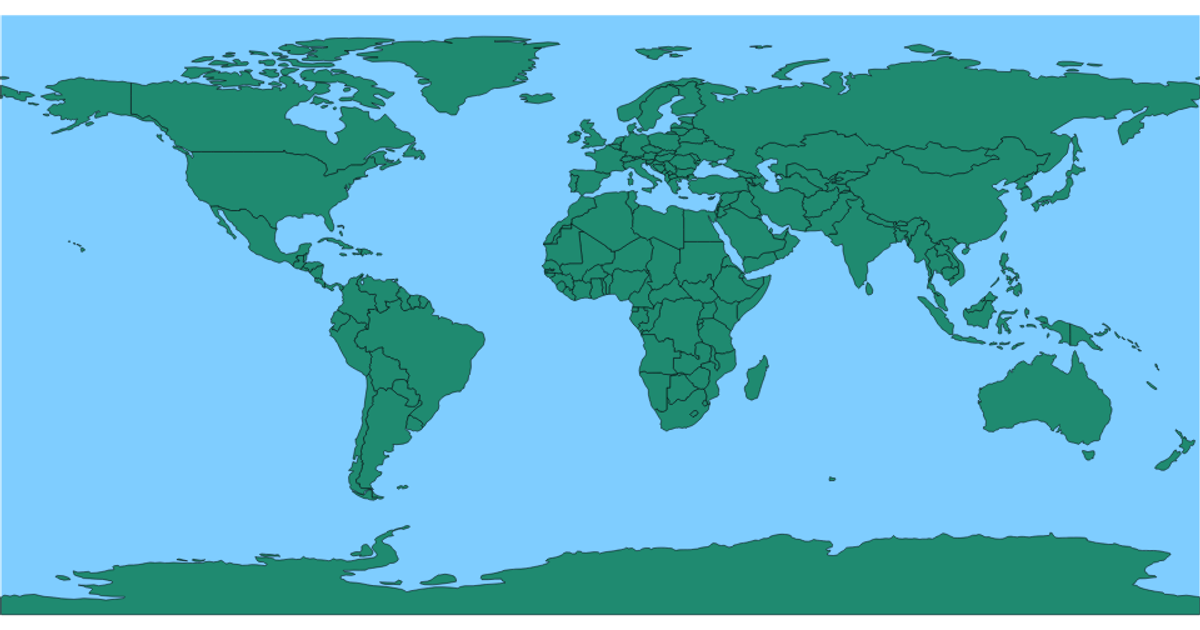
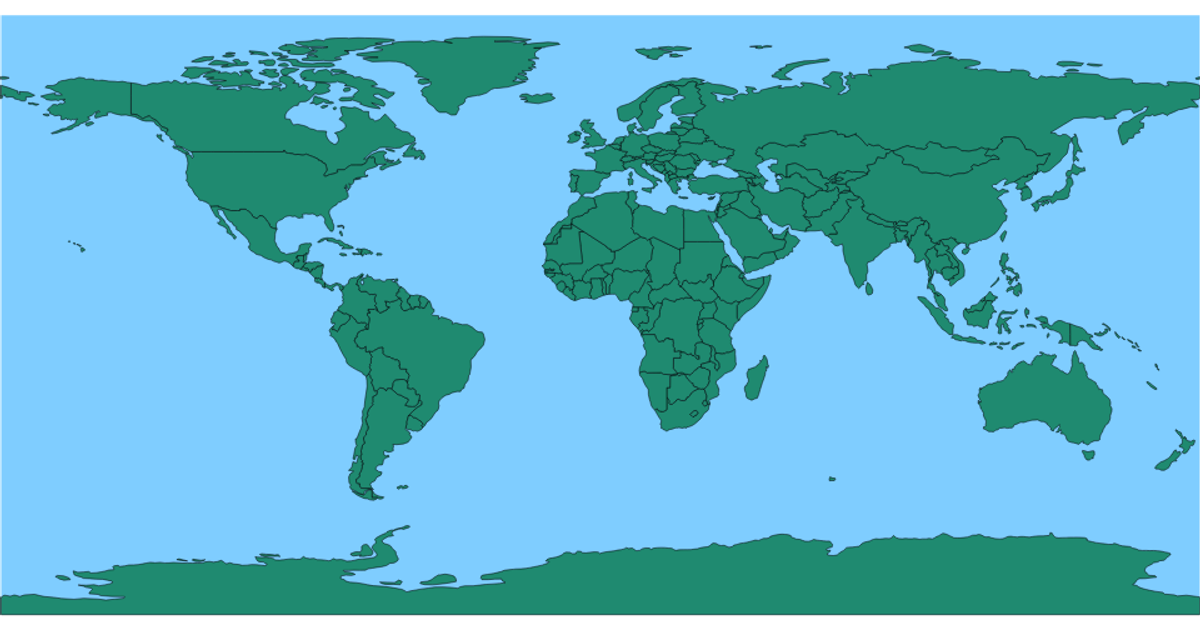
This example presents a world map where individual countries are rendered as filled shapes with black borders, and they change to a red highlight when hovered. The visualization uses a geographic projection, with the earth’s background colored light blue and landmasses in green, all rendered through SVG paths. The code relies on D3.js for map generation, specifically using `d3.geoPath` to convert GeoJSON data into paths, while the `styles.css` sets the body overflow to hidden and defines the fill and hover states for the country polygons. The interaction is limited to CSS-based hover effects, with no additional data simulation or dynamic behavior.
AI-generated descriptionMIT Licensed






Comments
Sign in to join the discussion.