🌍 Public
Fork of ICE 08 11540905
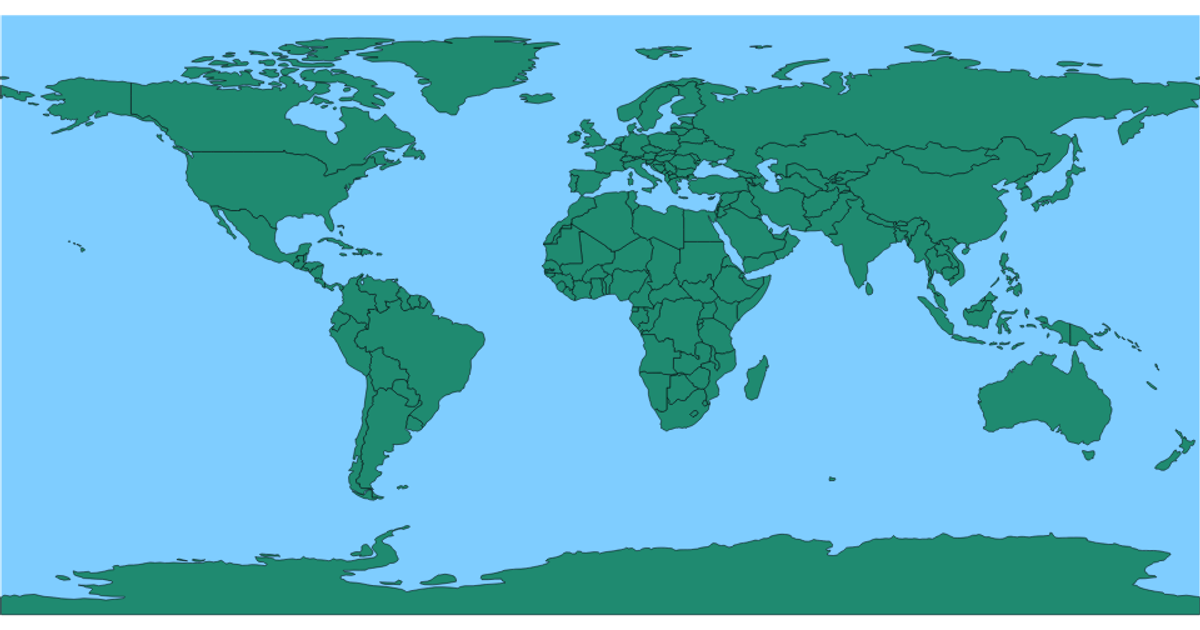
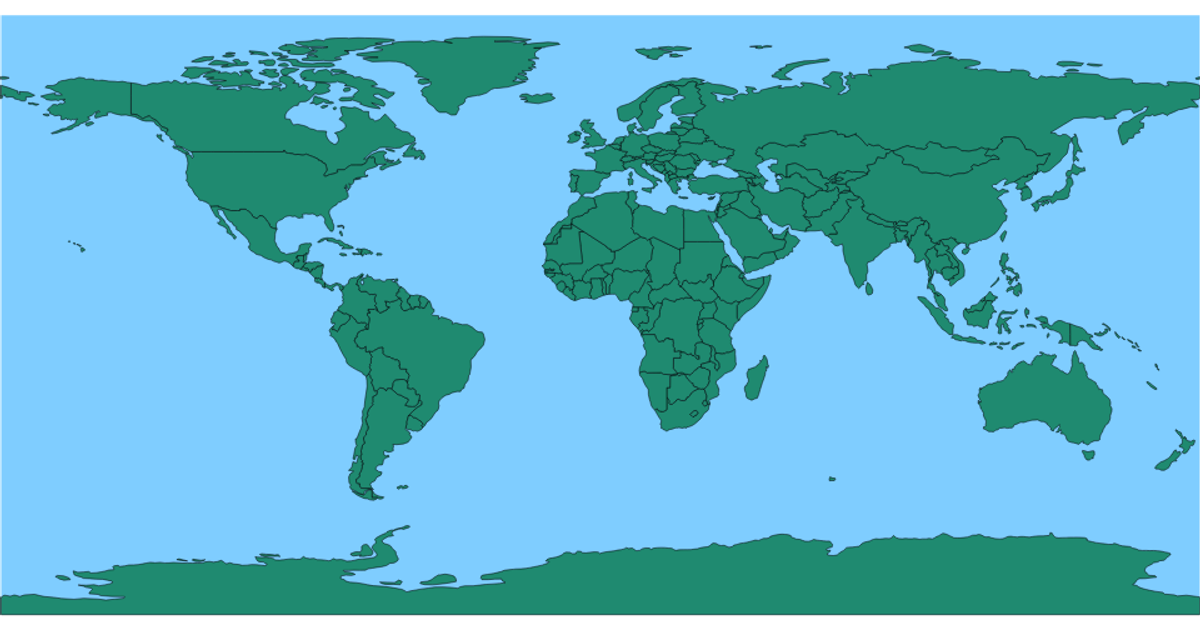
This example shows a world map with countries rendered in green and an ocean-blue background, highlighting how geographic boundaries appear on an equirectangular projection. When hovered, individual countries change color to red. The visualization uses d3.geoPath and d3.geoEquirectangular to project GeoJSON data from a TopoJSON source file, with the topojson.feature method converting the TopoJSON objects into drawable features. The SVG is styled using CSS classes for the earth background and country fills.
AI-generated descriptionMIT Licensed





Comments
Sign in to join the discussion.