🌍 Public
Fork of ICE 08 11540905
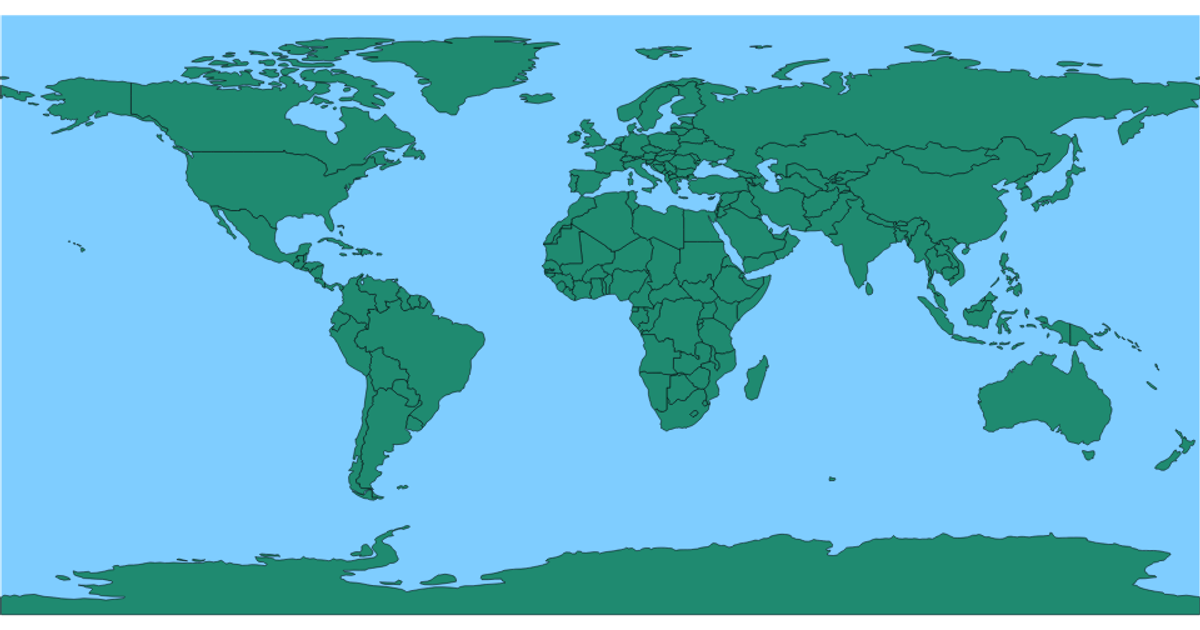
This visualization displays a world map with countries rendered as filled shapes. It uses D3 v5’s `geoEquirectangular` projection and `geoPath` to draw geographic boundaries from TopoJSON data loaded via `json()`. The map is an SVG with an orange ocean background, navy countries, and a red hover effect. Country borders are defined with a black stroke, and hovering any country changes its fill color.
AI-generated descriptionMIT Licensed




Comments
Sign in to join the discussion.