🌍 Public
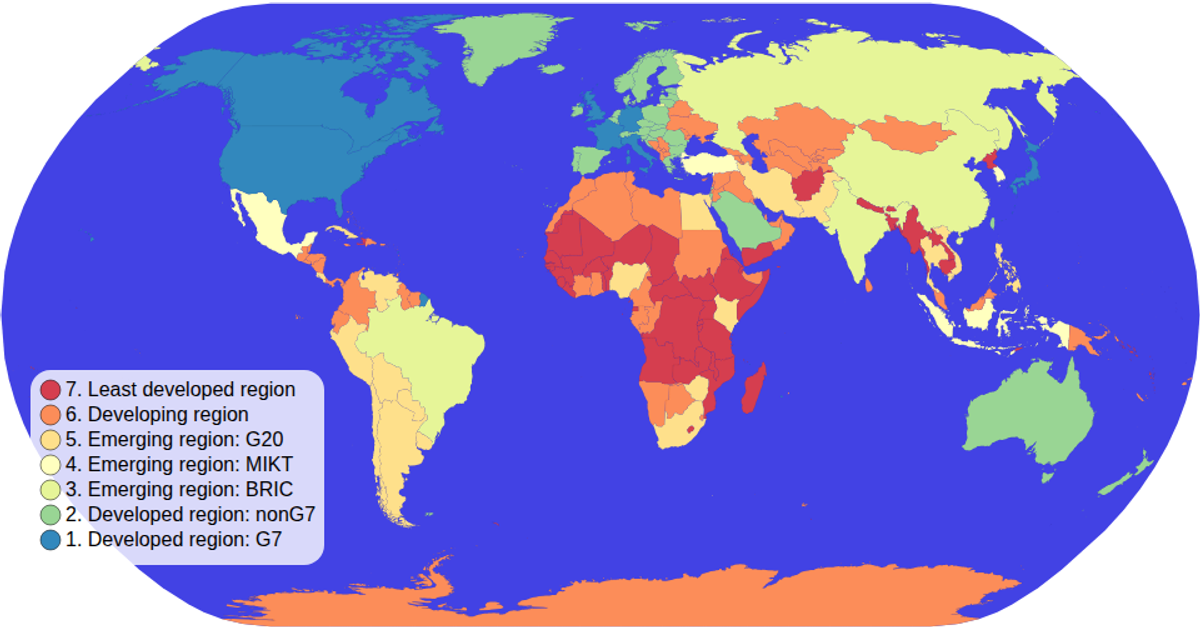
Map with Legends !
A choropleth map of global economies uses d3.geoNaturalEarth1 and d3.geoPath to render countries from TopoJSON data, with each nation’s fill color derived from a d3.scaleOrdinal using the schemeSpectral range. A custom color legend, built with SVG circles and text, displays the economy categories, while d3.zoom enables panning and zooming. Hovering highlights a country in red.
AI-generated descriptionMIT Licensed



Comments
Sign in to join the discussion.