🌍 Public
Choropleth Map
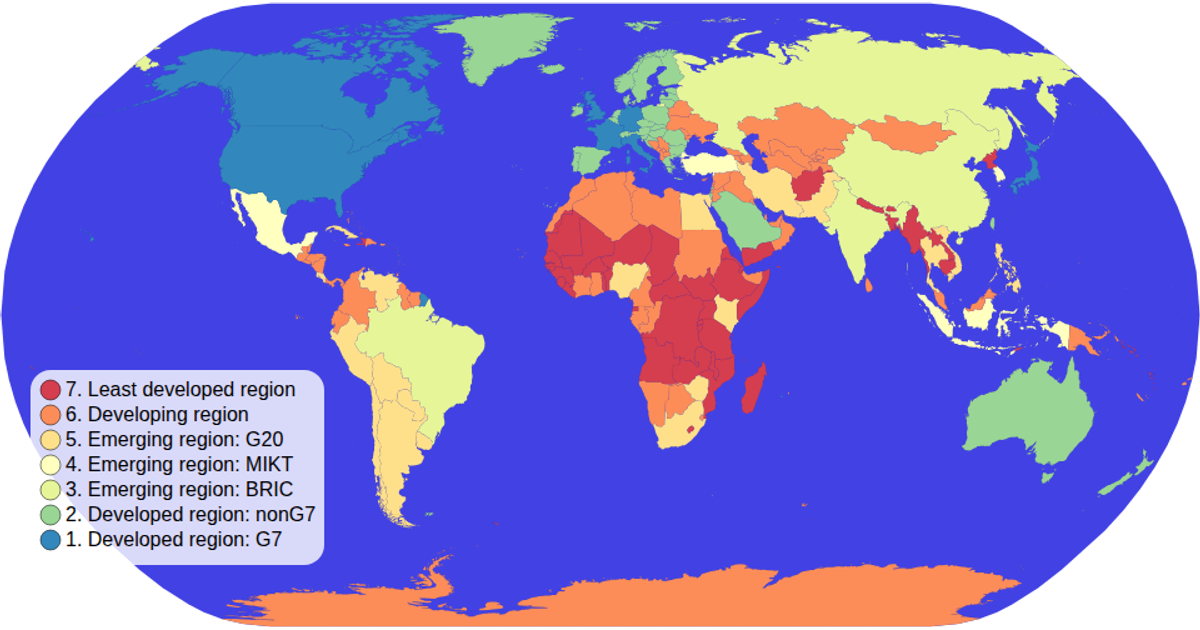
This choropleth map visualizes the economies of world countries using a spectral color scale. The implementation uses d3.geoPath with the natural Earth projection to render world geometry from TopoJSON and TSV data sources. The custom d3.scaleOrdinal color legend displays circles and text labels, while the map supports zooming through d3.zoom. Each country is colored by its economy value with hover effects that turn the landmass red, and tooltips reveal the country name and associated economic classification.
AI-generated descriptionMIT Licensed




Comments
Sign in to join the discussion.