🌍 Public
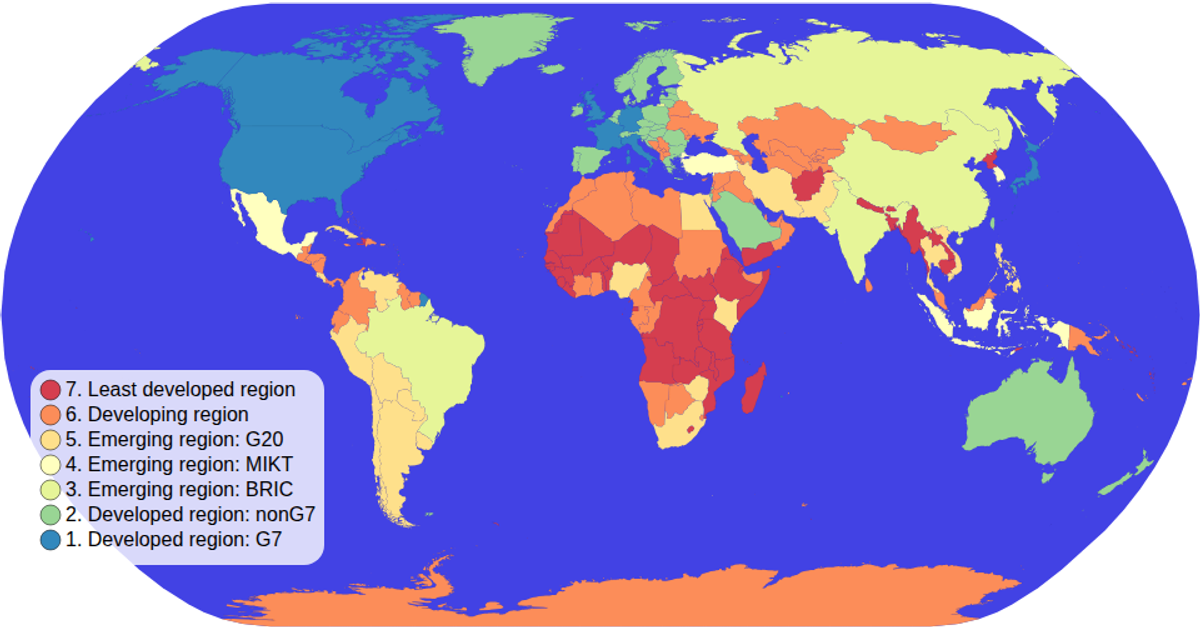
Map with Legends !
This map visualizes the economic classification of countries using a color scale, with an interactive legend that displays unique values and their corresponding colors. Built with D3 v5 and rendered as SVG, it uses `d3.geoNaturalEarth1` for projection and `d3.geoPath` to draw country boundaries from TopoJSON data sourced from World Atlas. The color legend is created via a custom function that binds `d3.scaleOrdinal` with `d3.schemeSpectral`, while zooming is handled by `d3.zoom`.
AI-generated descriptionMIT Licensed




Comments
Sign in to join the discussion.