🌍 Public
Migration to US chart
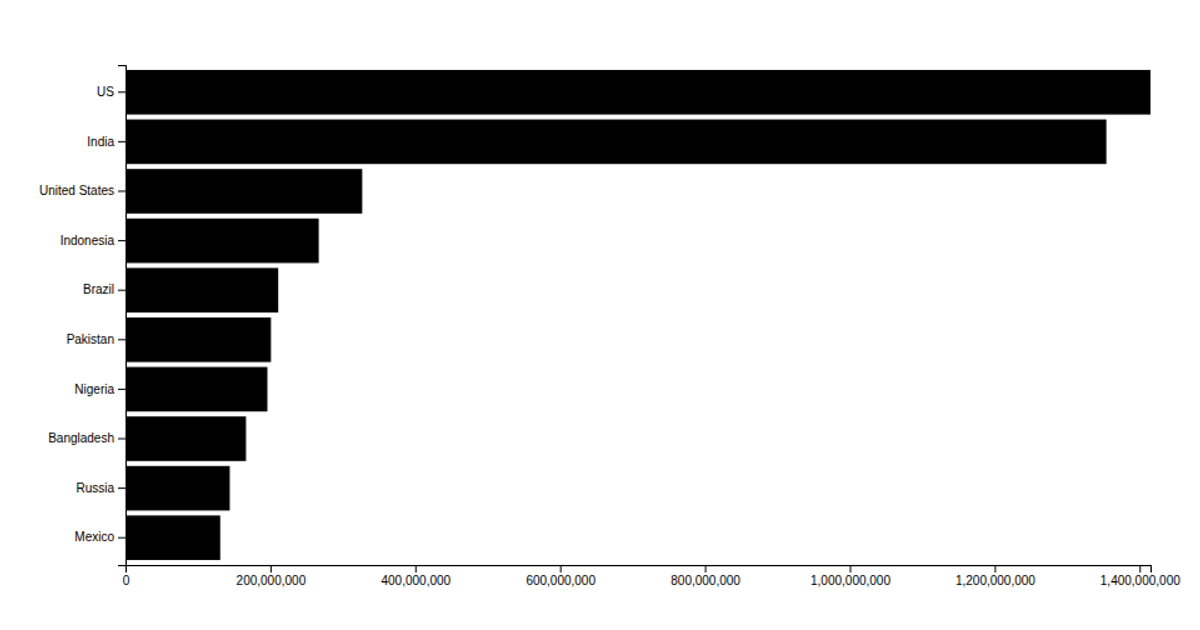
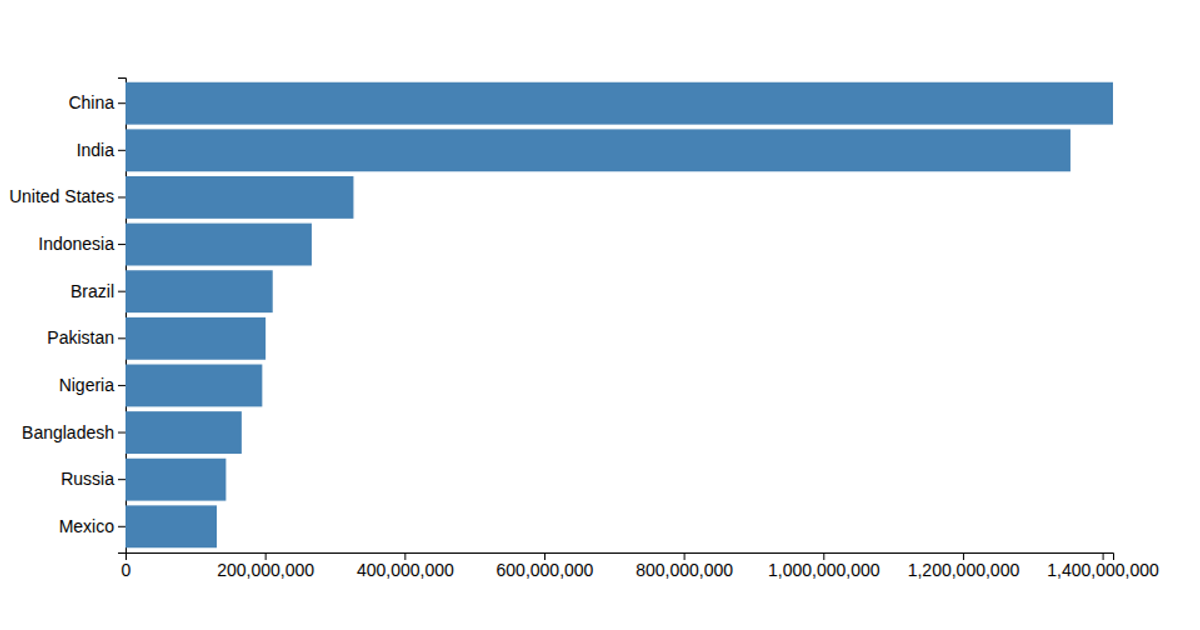
This example attempts to visualize migration to the US using a bar chart built with Chart.js. It loads CSV data via a fetch request and parses it with `d3.csvParse`, though the data is not explicitly bound to the chart. The chart configuration includes placeholders for two datasets, axes for countries and migrant counts, and renders on a canvas element. The code references d3.v7 but relies primarily on Chart.js for the visualization.
AI-generated descriptionA bare minimum HTML page demonstrating use of CSS and JavaScript.
See also React Starter.
MIT Licensed




Comments
Sign in to join the discussion.