🌍 Public
Migrant Dataset
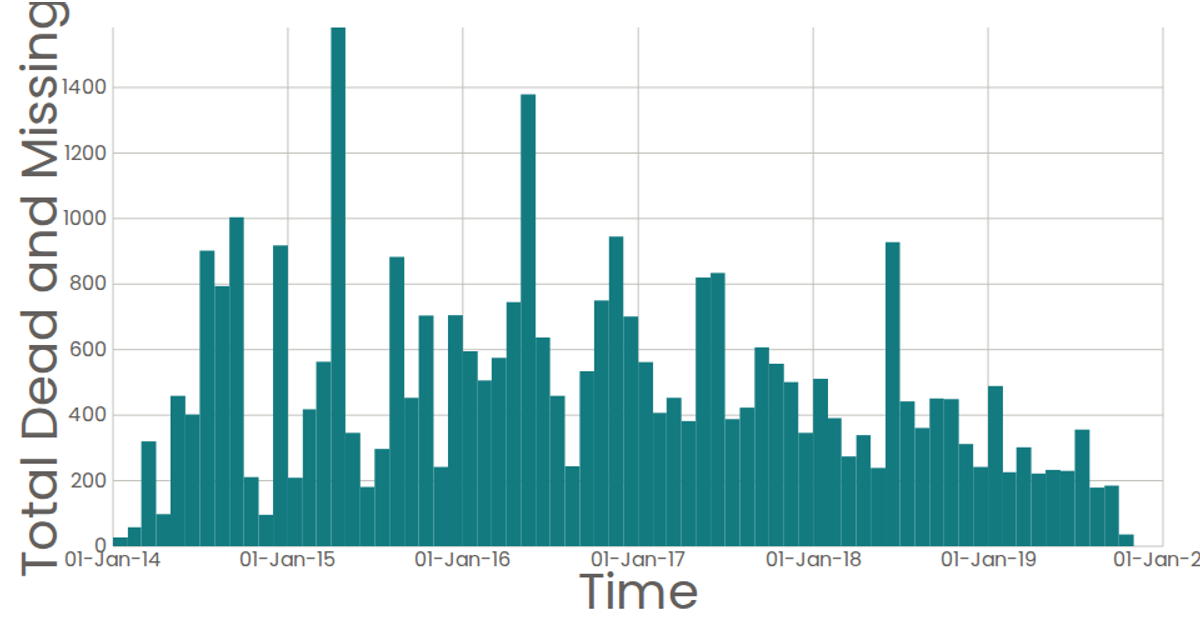
This visualization displays a bar chart of migrant deaths and missing persons over time, aggregated by month. The chart uses SVG rendering with React and D3.js v7, employing `scaleTime` for the x-axis and `scaleLinear` for the y-axis. Data is binned using `bin()` with monthly thresholds, and the sum of deaths per bin is computed. Hovering over a bar reveals the exact count via a tooltip. The dataset is loaded from a CSV file.
AI-generated descriptionMIT Licensed


Comments
Sign in to join the discussion.