🔗 Unlisted
Scatterplot Zahlungsbereitschaft
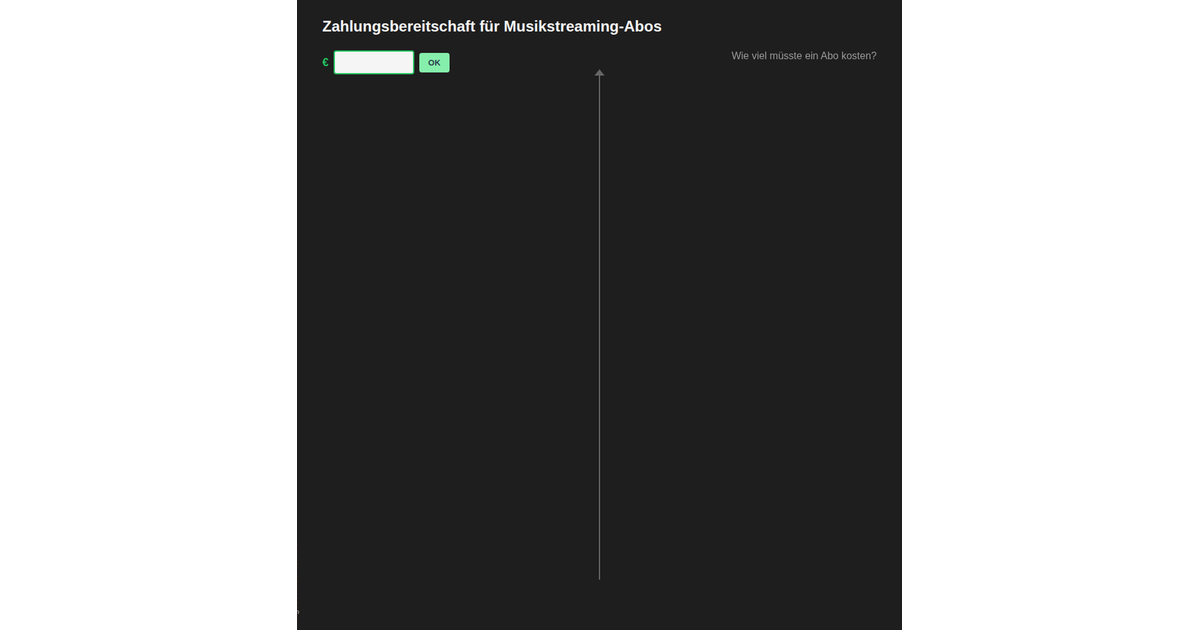
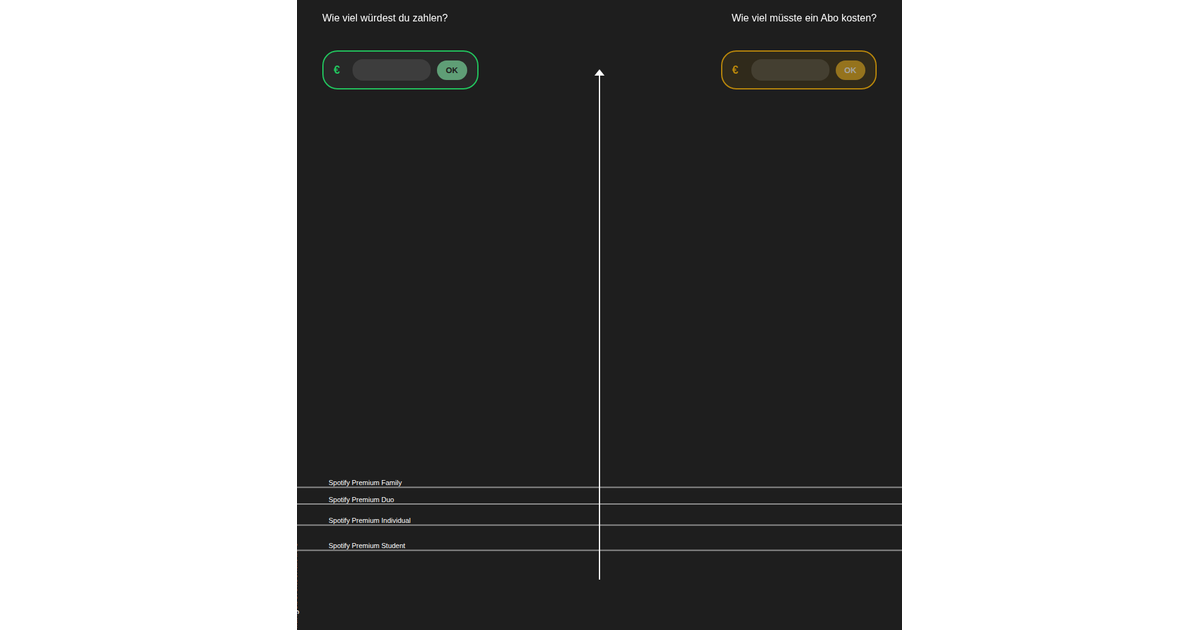
This visualization presents survey responses about how much users would pay monthly for a music streaming subscription, displayed as a bubble chart overlaid on a y-axis of willingness to pay in euros. The React app loads CSV data and uses D3’s `forceSimulation`, `forceX`, `forceY`, and `forceCollide` to position bubbles in rows by amount, with circle sizes scaled to fit the viewport. Users can submit their own amount, which adds a bubble and enables clicking or hovering any bubble to reveal the respondent’s reasoning in an info panel.
AI-generated descriptionMusic Streaming Survey Visualization
Interactive visualization of survey data about maximum amounts users would pay for music streaming services.
Features
- Bubble Chart: Visualizes survey responses grouped by maximum amount (€)
- Interactive: Click on bubbles to see the reasoning behind each response
- Responsive: Adapts to different screen sizes
Data
The visualization uses data.csv containing:
Maximaler_Betrag_Euro: Maximum amount in euros the respondent would payBegruendung: Reasoning/justification for the amount
Technologies
- React 19
- D3.js 7
- CSS3
MIT Licensed

Comments
Sign in to join the discussion.