🔗 Unlisted
Fork of Scatterplot Zahlungsbereitschaft
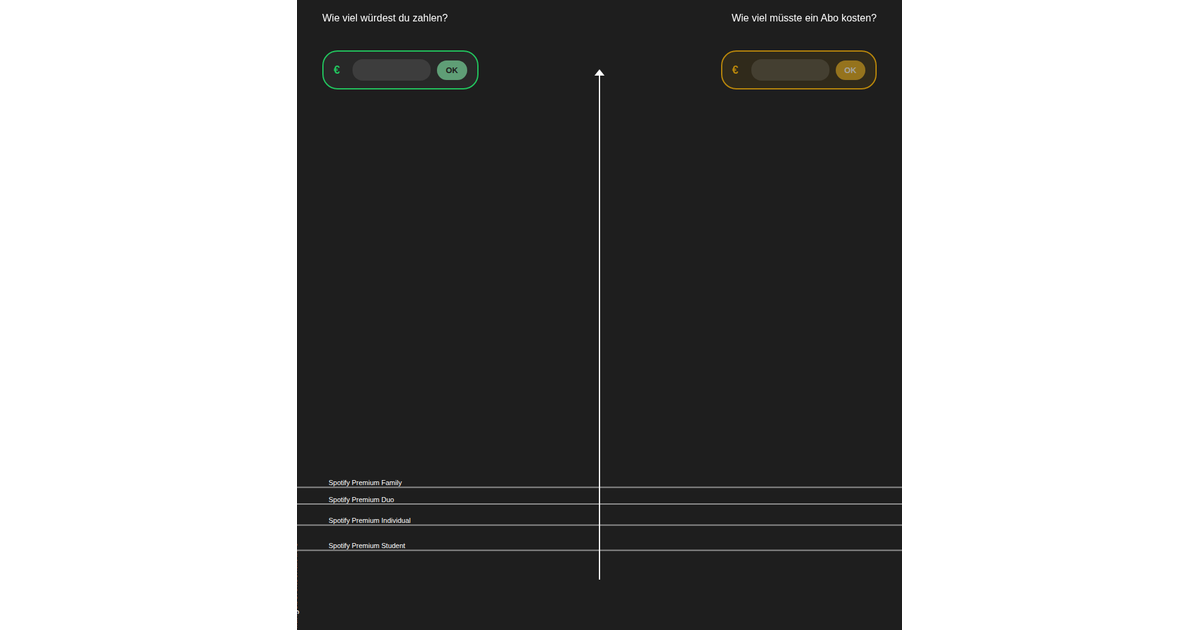
This interactive scatterplot visualizes survey responses about how much people would pay for a music streaming subscription, with each bubble representing a participant’s maximum monthly amount in euros. Users can enter their own value to add a purple bubble to the chart. Clicking or hovering over any bubble reveals the participant’s written justification in a side panel. Built with React and D3 v7, the visualization uses `d3.forceSimulation` with `forceX`, `forceY`, and `forceCollide` to arrange overlapping bubbles, while SVG circles are rendered dynamically based on container dimensions.
AI-generated descriptionMIT Licensed

Comments
Sign in to join the discussion.