🌍 Public
Scatterplot Zahlungsbereitschaft & Preise
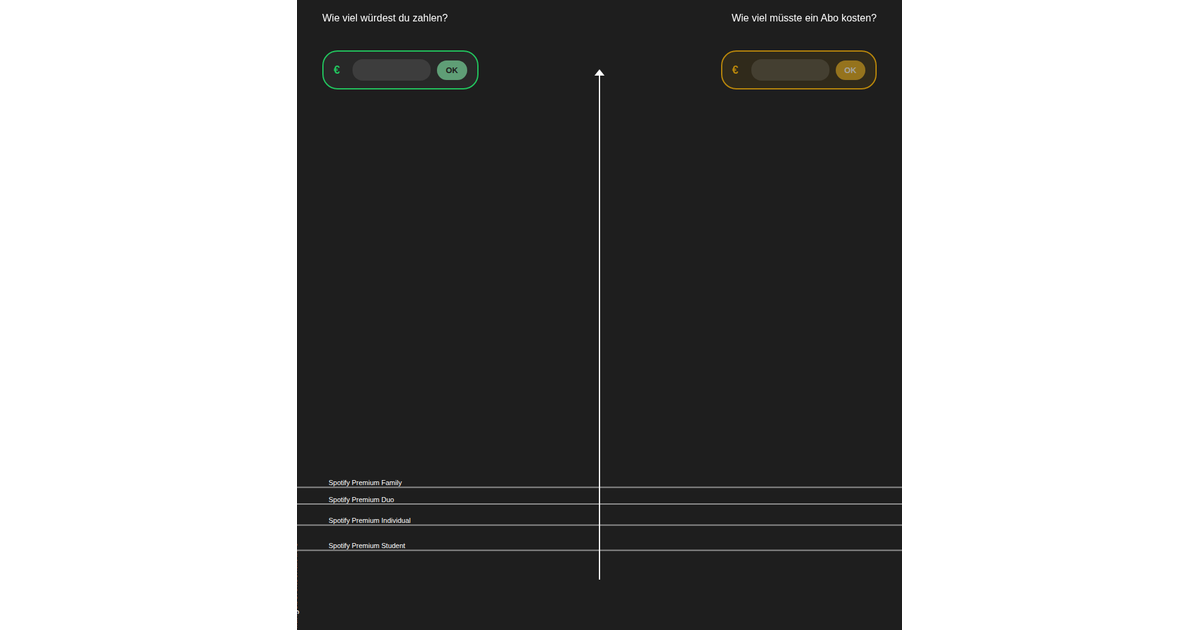
This interactive scatterplot visualizes survey responses on willingness to pay for music streaming subscriptions, with each bubble representing an individual's maximum price in euros. Users can submit their own answer, which appears as a distinct purple bubble, and click or hover over bubbles to view accompanying text justifications. The visualization uses d3.forceSimulation with forceX, forceY, and forceCollide to position overlapping bubbles efficiently. A y-axis with tick marks shows the price scale, while blue circles represent participants' estimates of Spotify's actual price. The implementation uses React with D3 v7 and renders SVG elements.
AI-generated descriptionMIT Licensed





Comments
Sign in to join the discussion.