🌍 Public
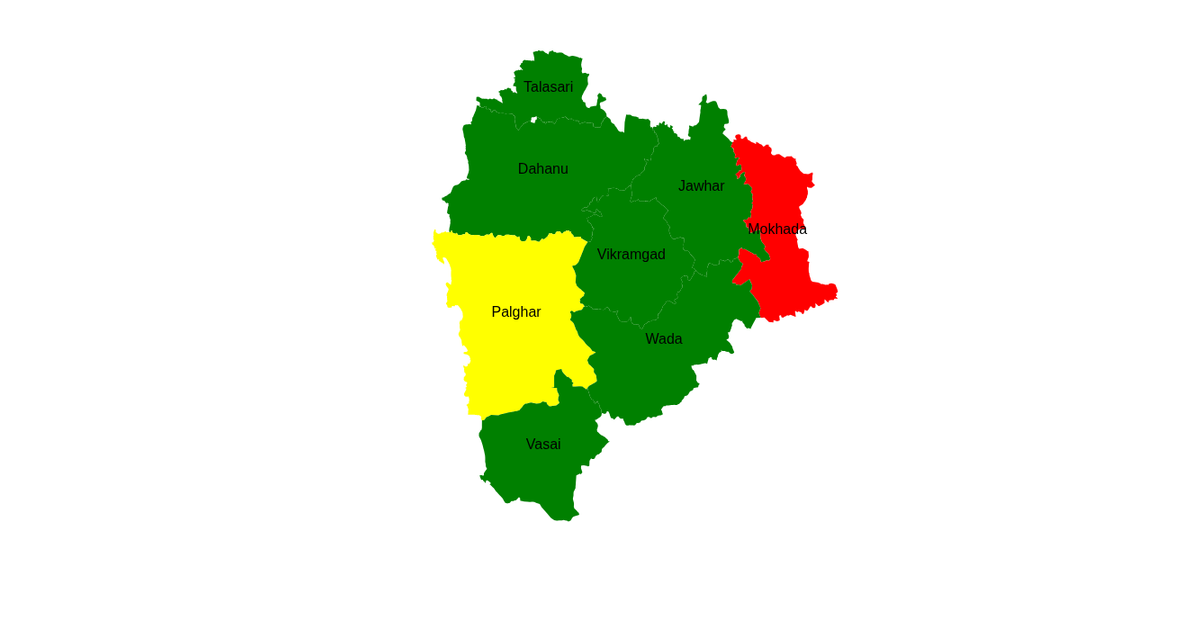
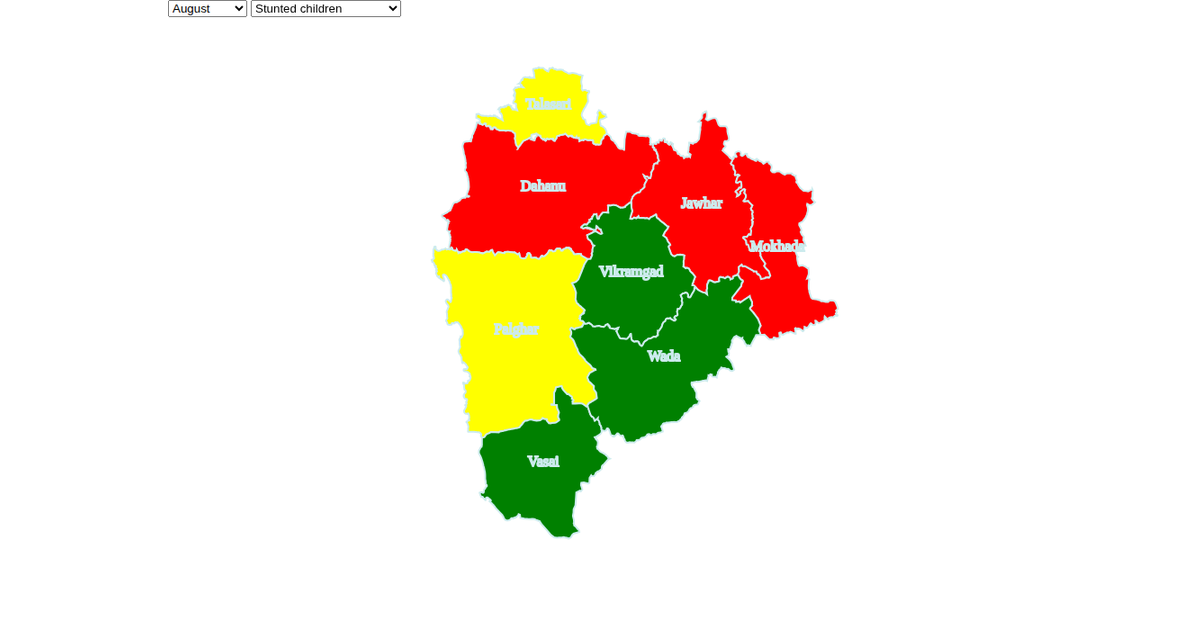
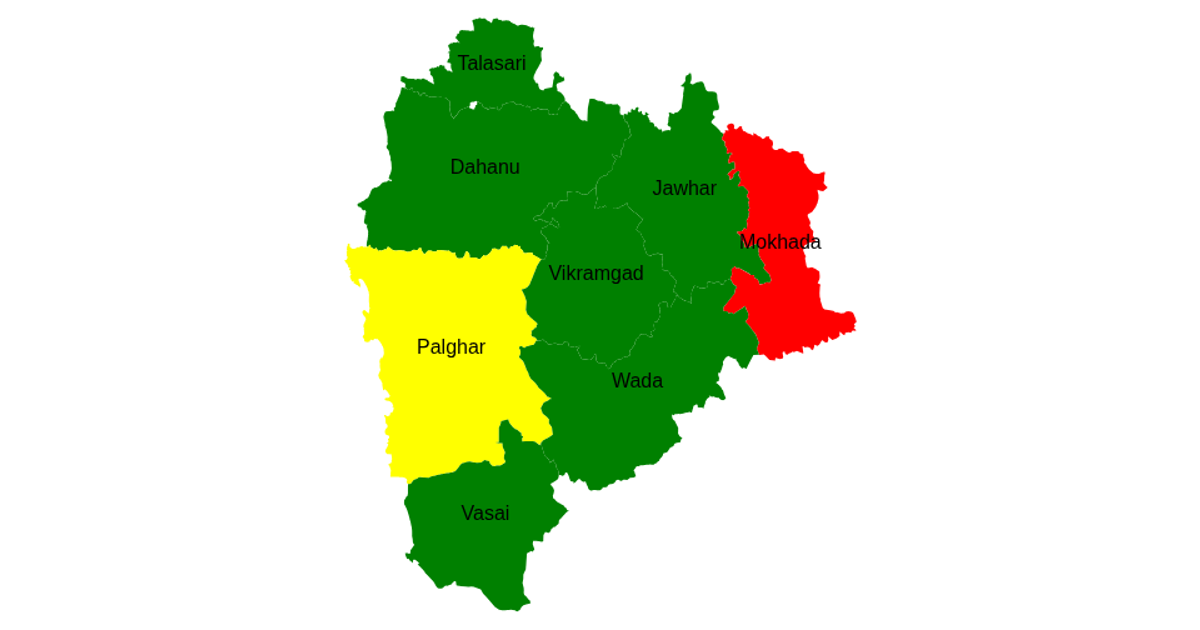
map with categaory
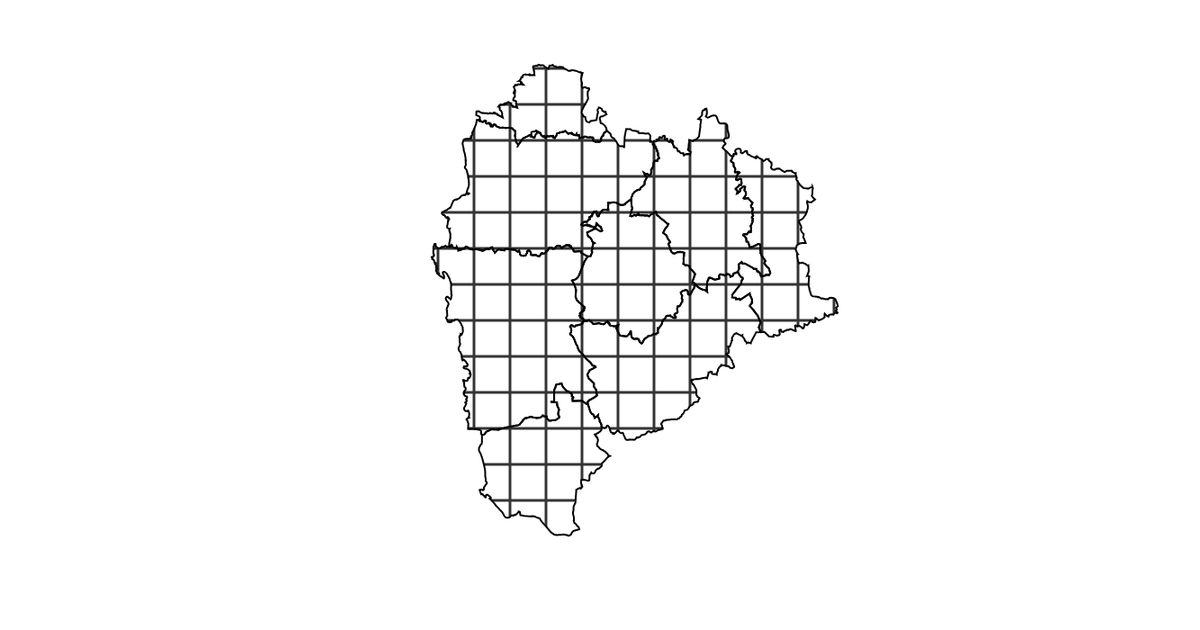
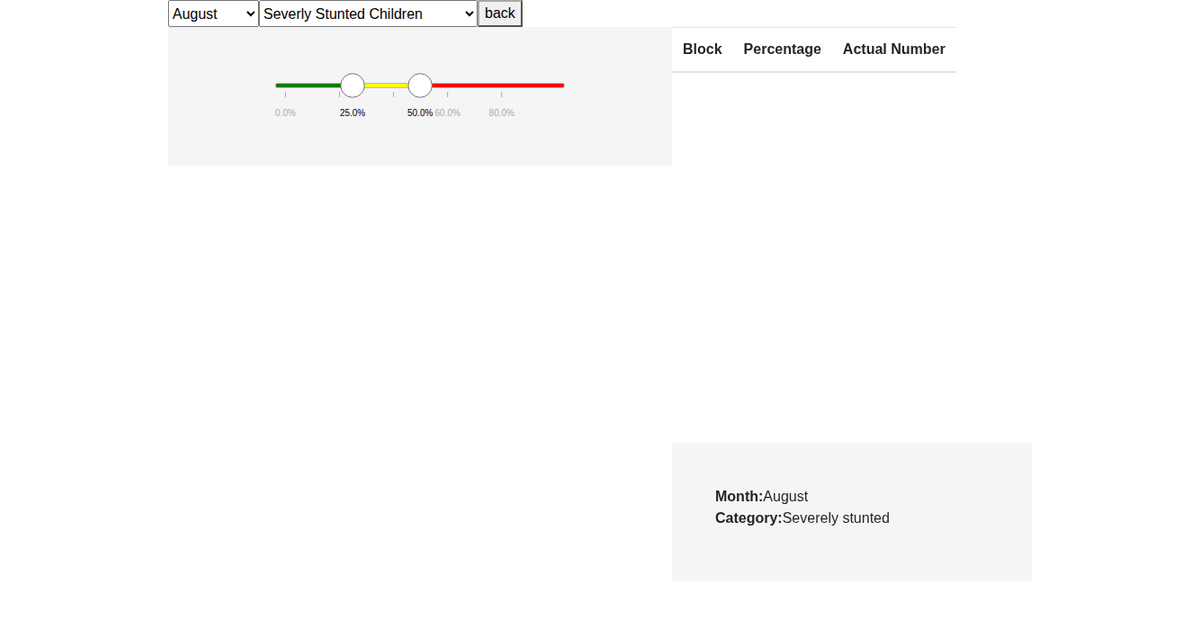
This example displays a choropleth map of Palghar district blocks, colored by two quantitative categories (c1 and c2) selectable via a dropdown menu. The map renders GeoJSON polygons using `d3.geoPath` and `d3.geoMercator`, with colors assigned by dividing each category’s range into three bins (red, yellow, green). A tooltip appears on hover, and both the map and dropdown are animated with `d3.transition`. Zooming is enabled via `d3.zoom`, and data from a CSV file is joined to the GeoJSON.
AI-generated descriptionMIT Licensed



Comments
Sign in to join the discussion.