🌍 Public
Map drill down
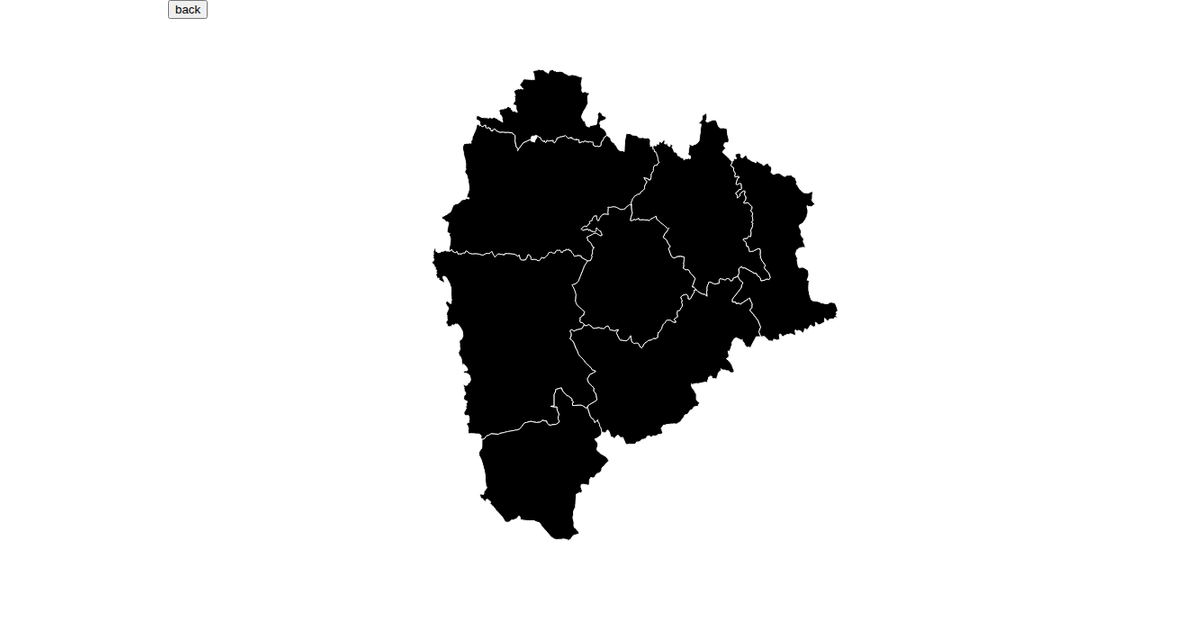
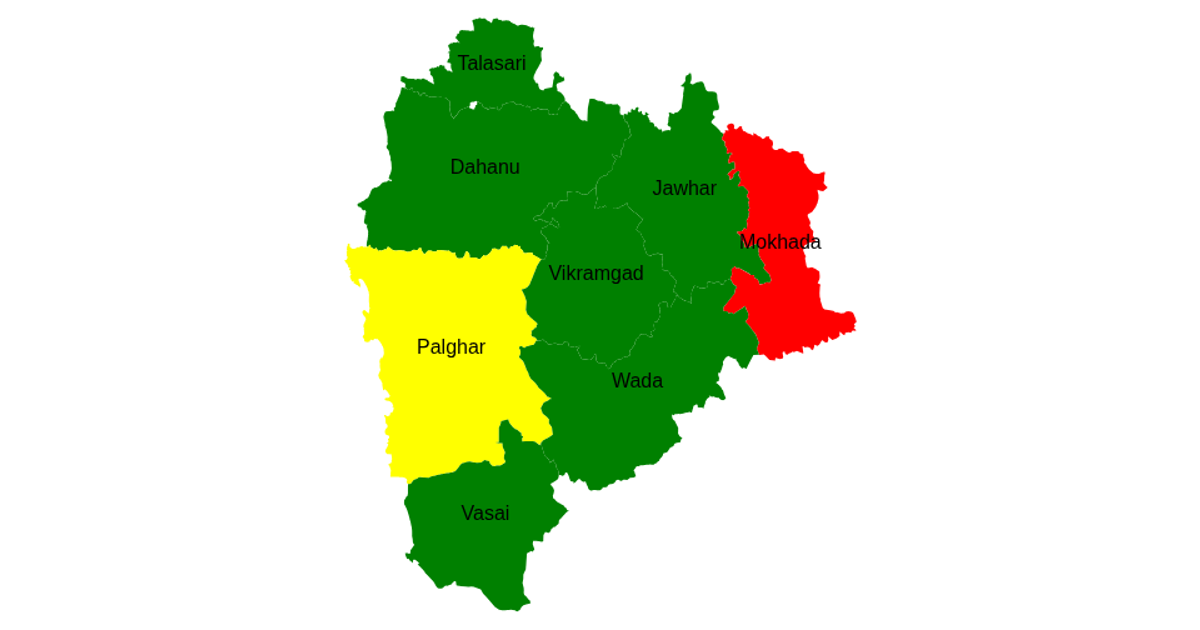
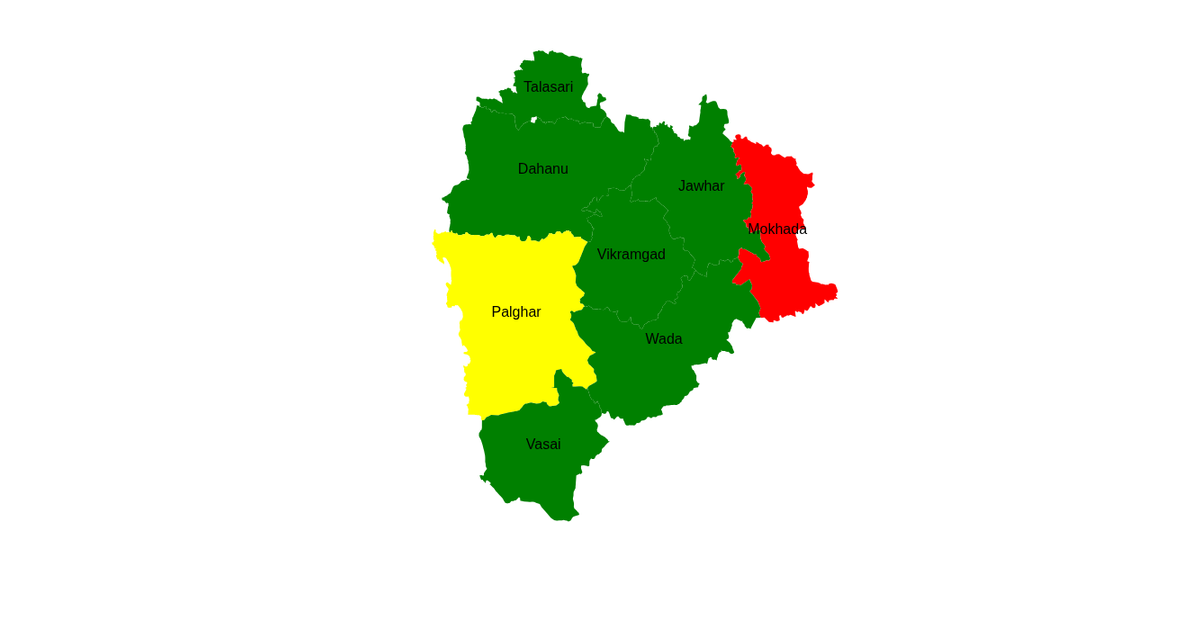
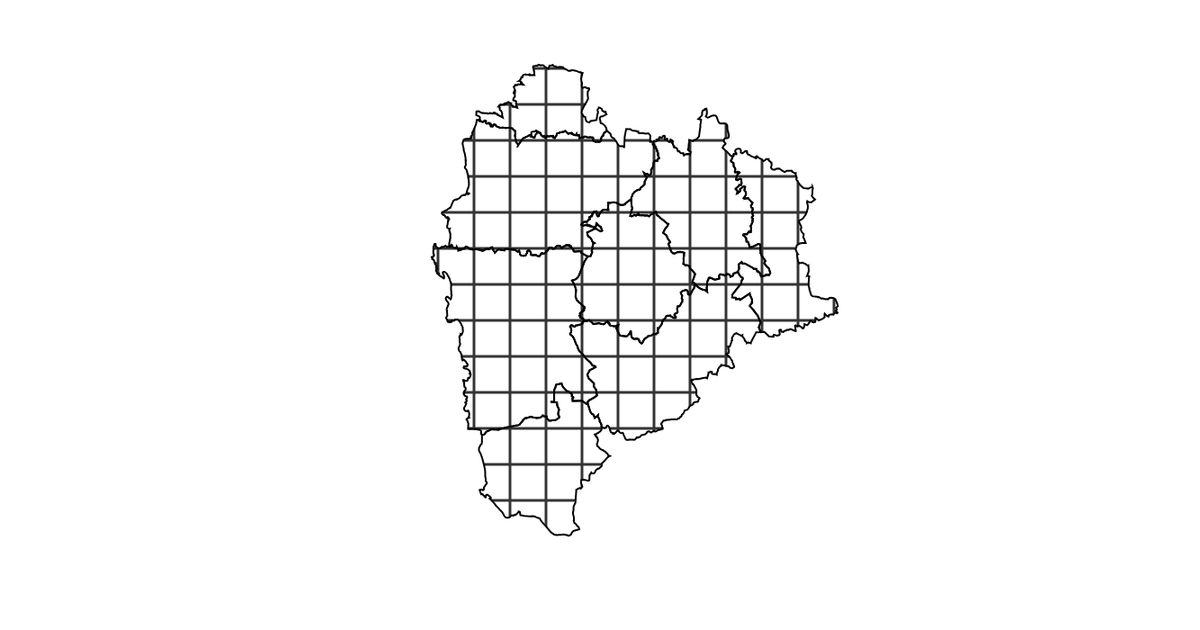
This example demonstrates a drill-down choropleth map of Palghar district blocks, colored by data values from an external CSV. It shows a tooltip on hover and supports pan/zoom interaction. Built with D3 v5, it uses `d3.geoMercator`, `d3.geoPath`, and `d3.zoom` to render and manipulate SVG paths from GeoJSON data, while `d3.csv` and `d3.json` merge the dataset with geographic boundaries.
AI-generated descriptionMIT Licensed




Comments
Sign in to join the discussion.