🌍 Public
month + category map
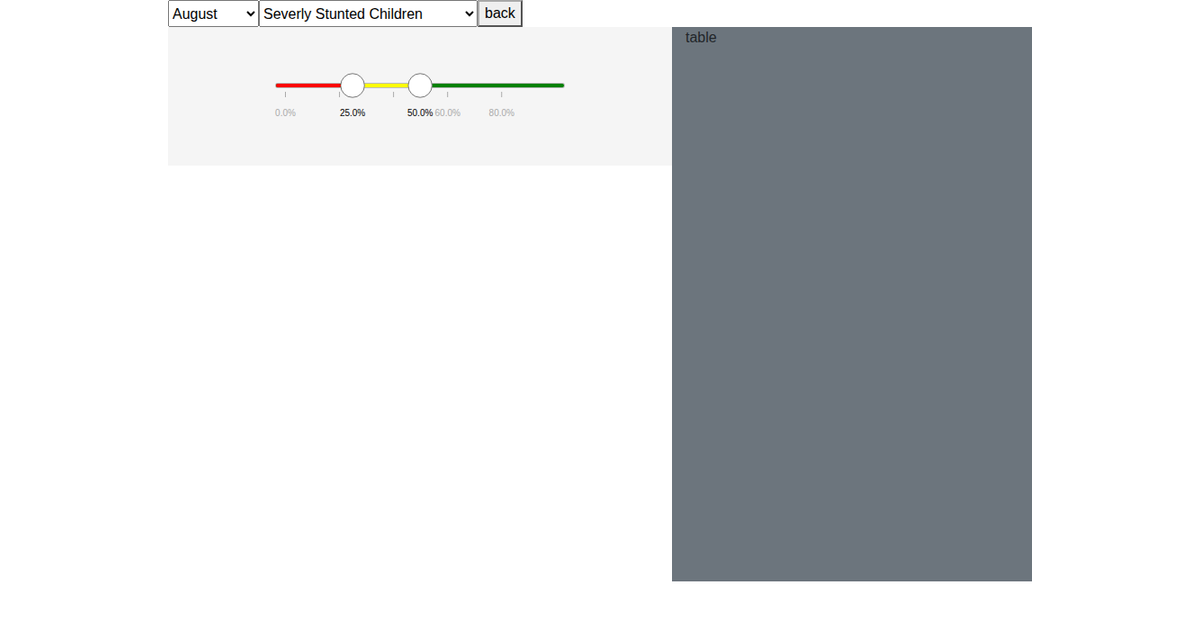
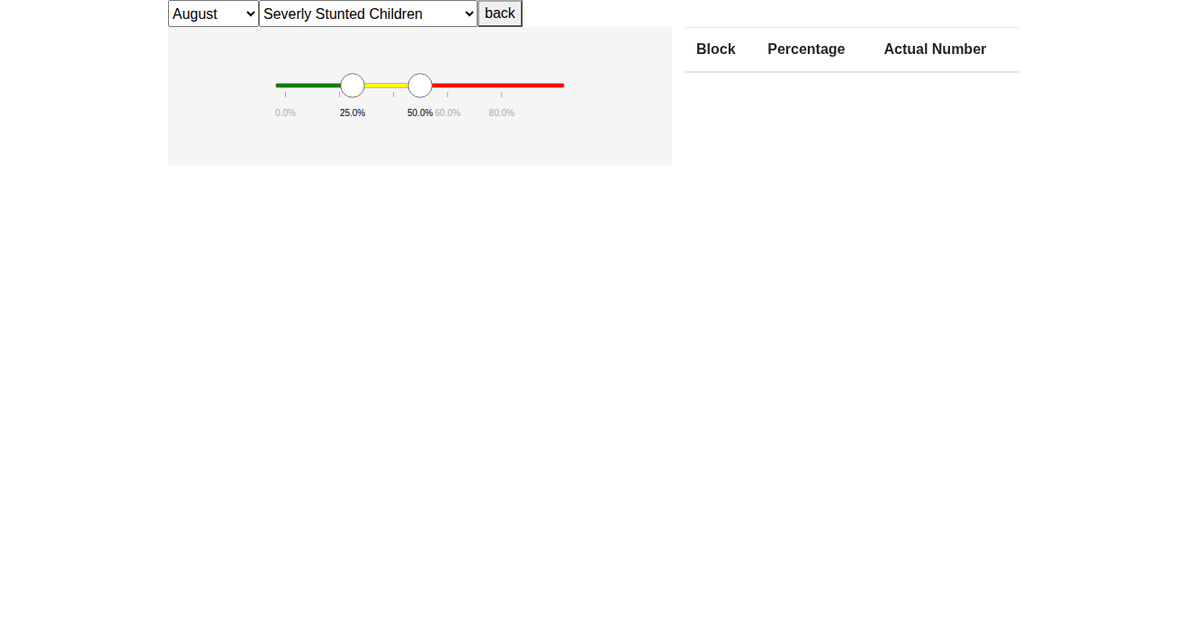
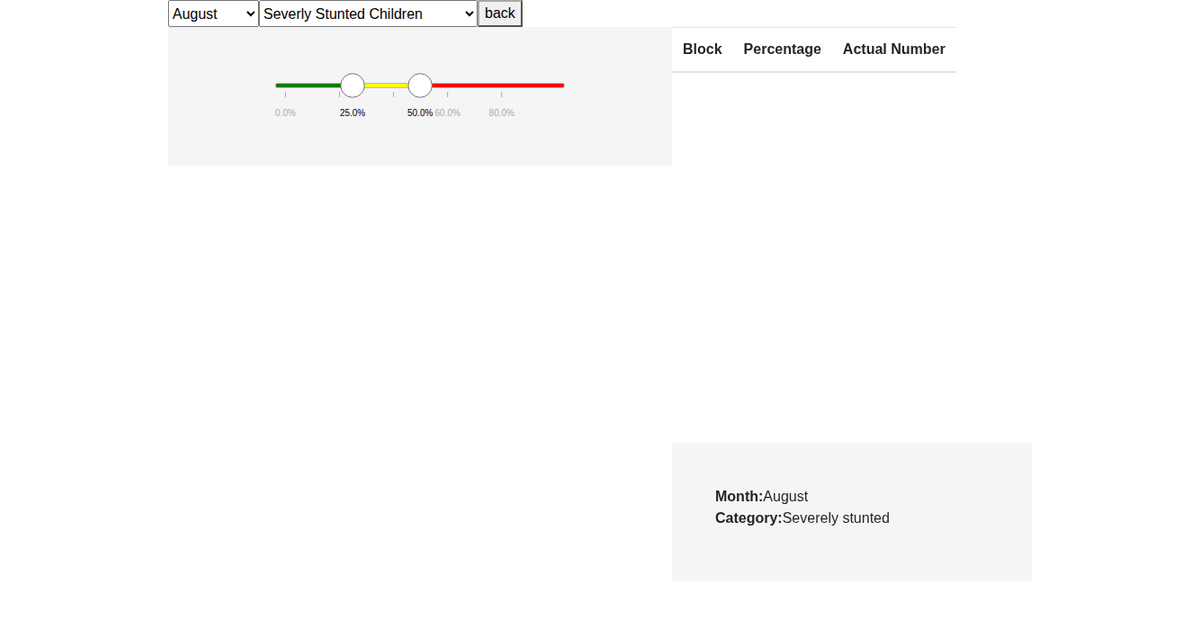
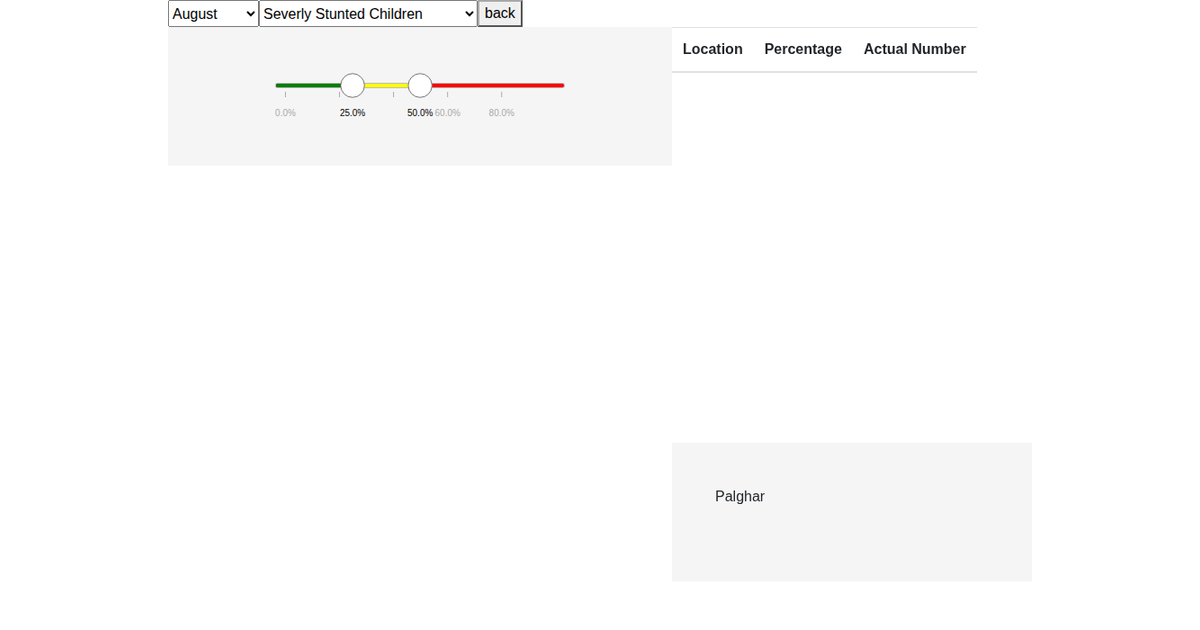
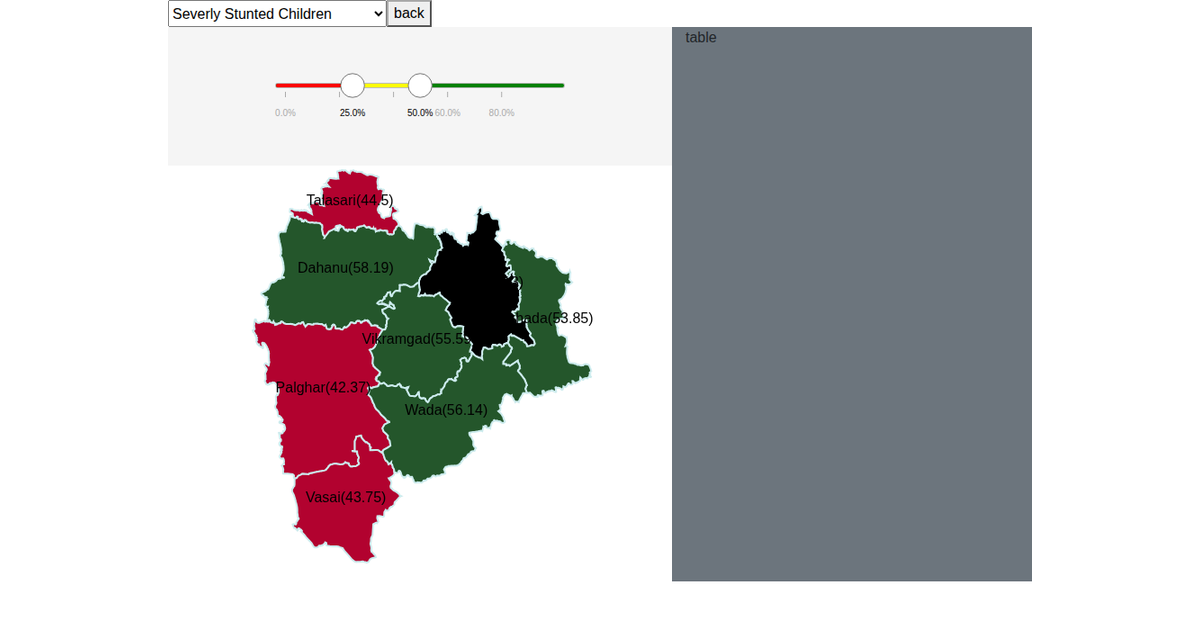
A choropleth map of Palghar district highlights child nutrition indicators across eight blocks, with dropdown menus to switch between August, September, and October, and between stunted or severely stunted child counts. The map renders block polygons from a GeoJSON file using d3.geoPath with a Mercator projection, and colors each block red, yellow, or green based on a three-tier threshold. D3 transitions animate the fill changes when a new month or metric is selected, and hovering shows a tooltip with additional stunting, underweight, and low birth weight percentages. Data comes from monthly CSV files merged into the GeoJSON properties.
AI-generated descriptionMIT Licensed



Comments
Sign in to join the discussion.