🌍 Public
(adding awc level)
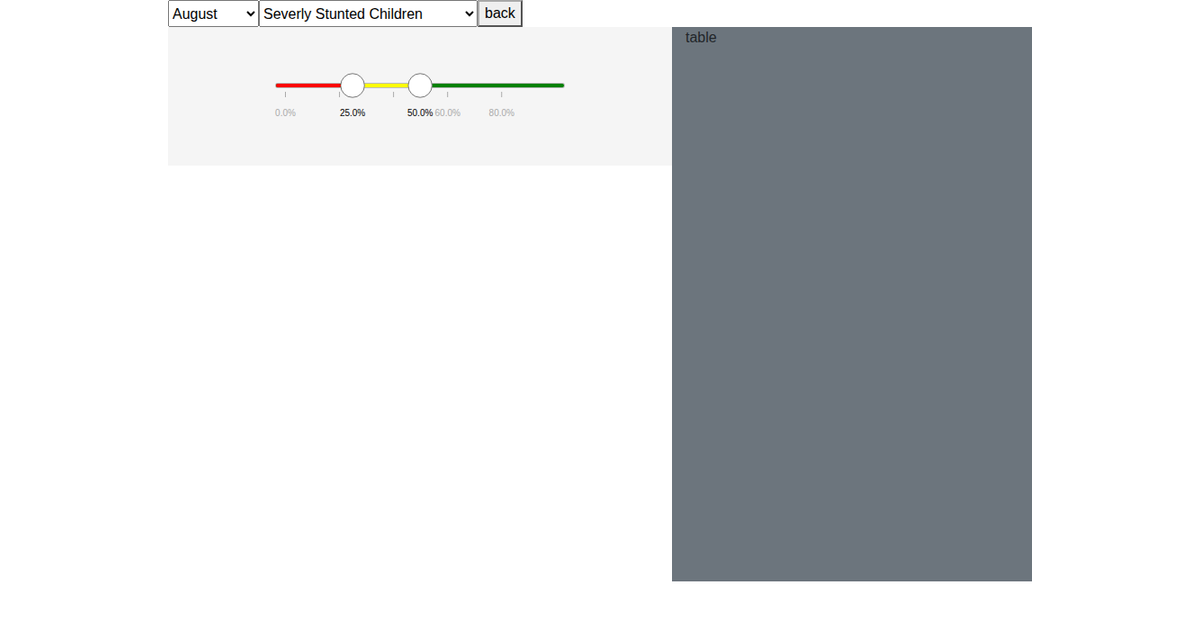
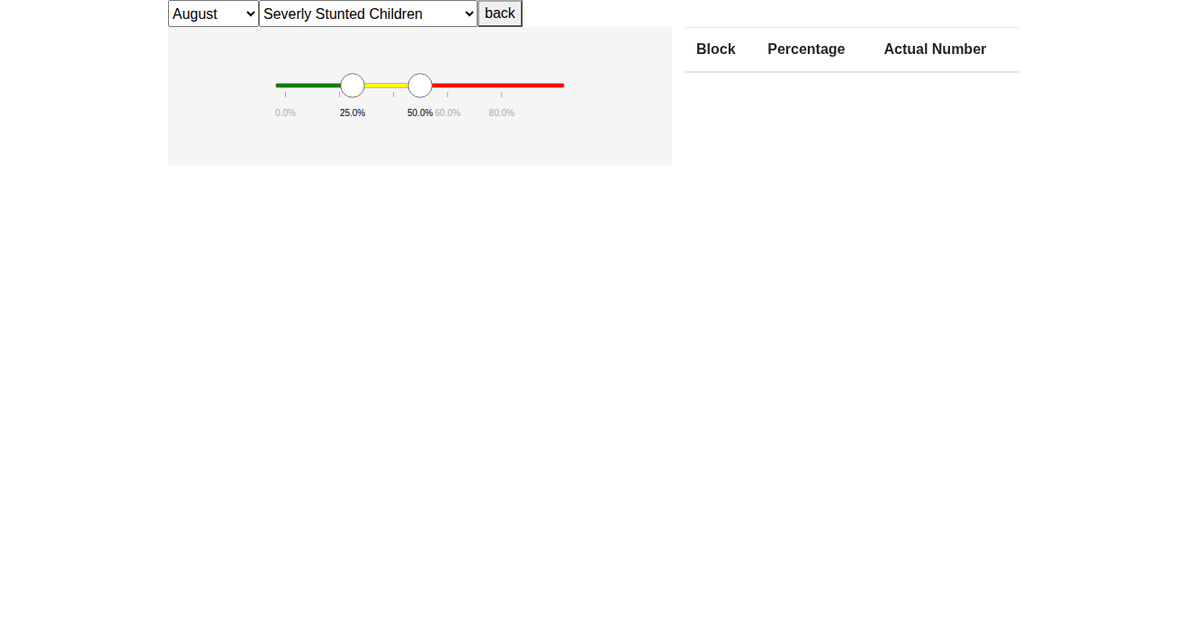
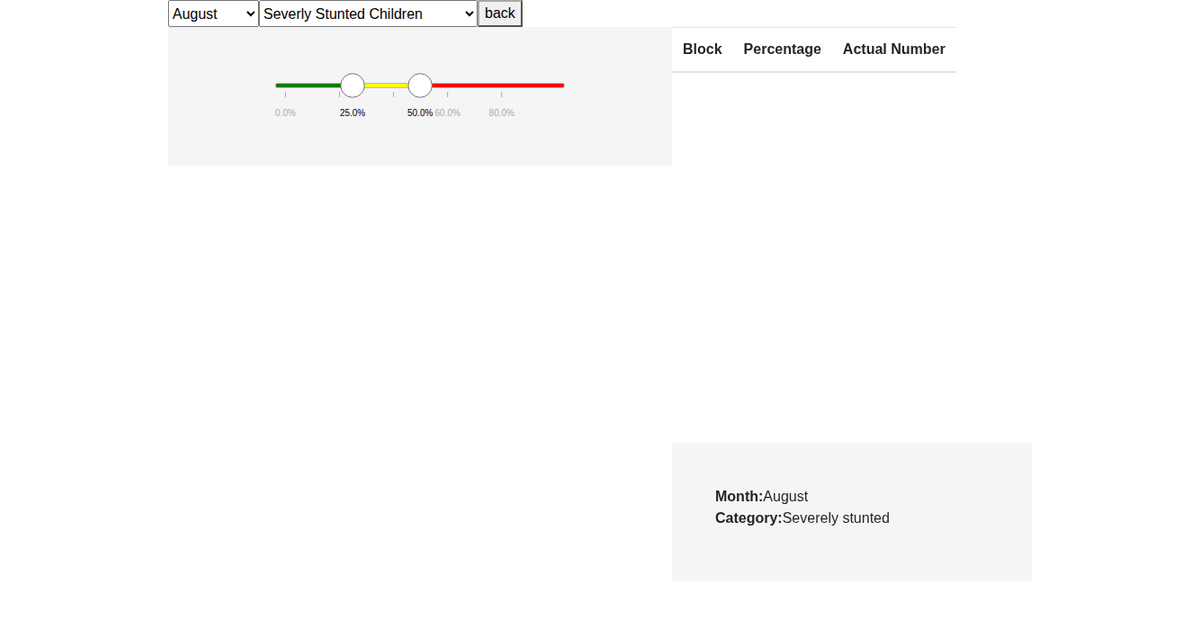
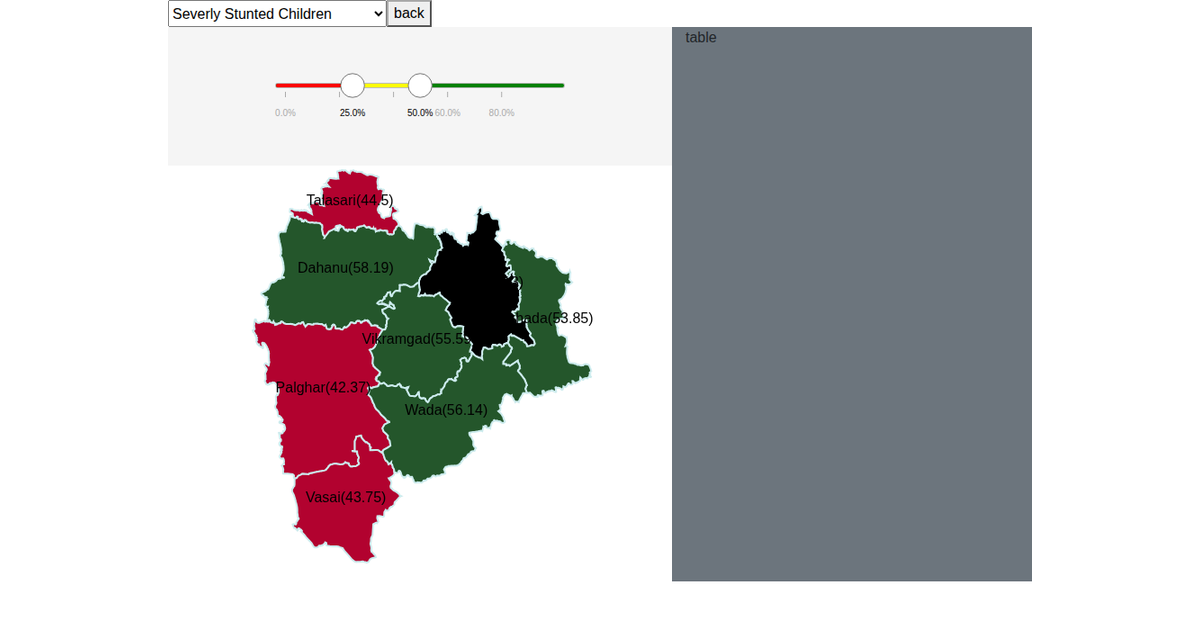
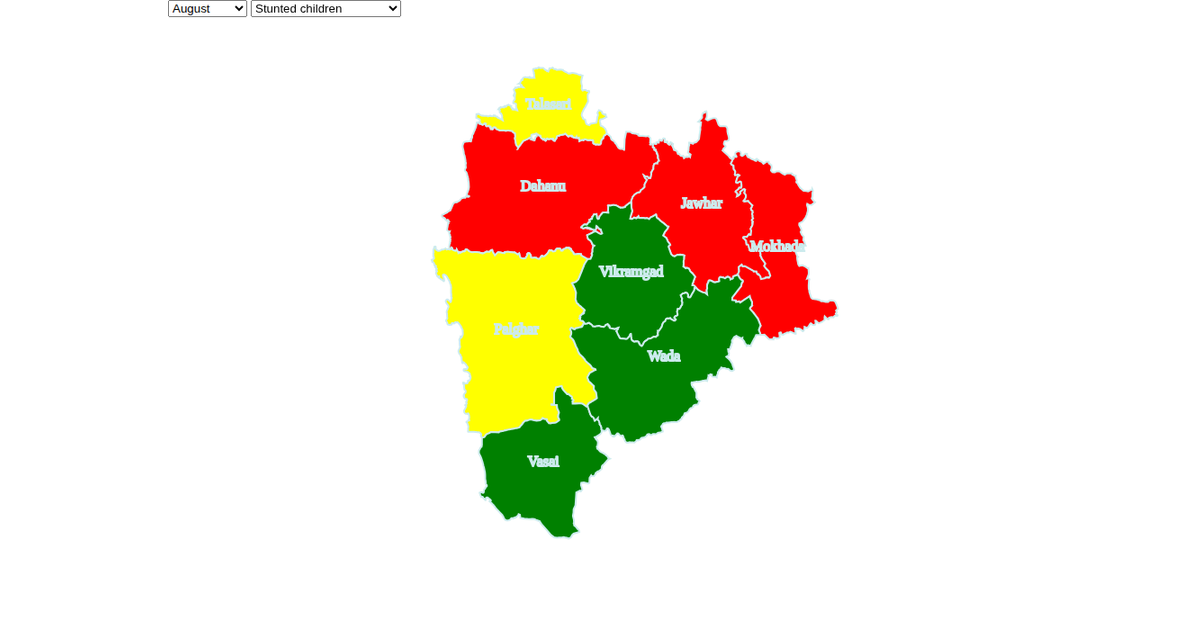
This visualization presents an interactive choropleth map of Palghar district, India, showing child health metrics such as stunting and underweight prevalence across administrative levels (block, project, beat, and AWC). Users can select a month and health category via dropdowns, and a slider filters the displayed range. The map, built with D3 v5 and SVG, uses a Mercator projection (`d3.geoPath`, `d3.geoMercator`) and updates polygon colors and labels dynamically. A tooltip, data table, and zoom functionality (`d3.zoom`) enhance exploration of the GeoJSON-based geographic and attribute data.
AI-generated descriptionMIT Licensed



Comments
Sign in to join the discussion.