🌍 Public
Final Project: 2024 Boston Marathon Data Vis
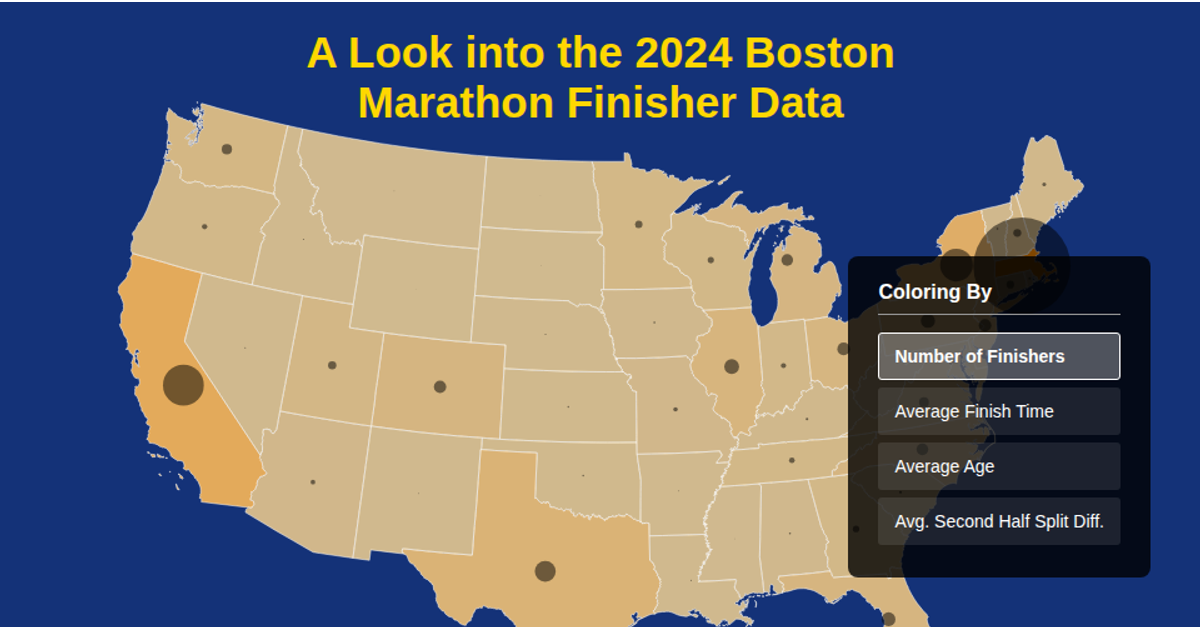
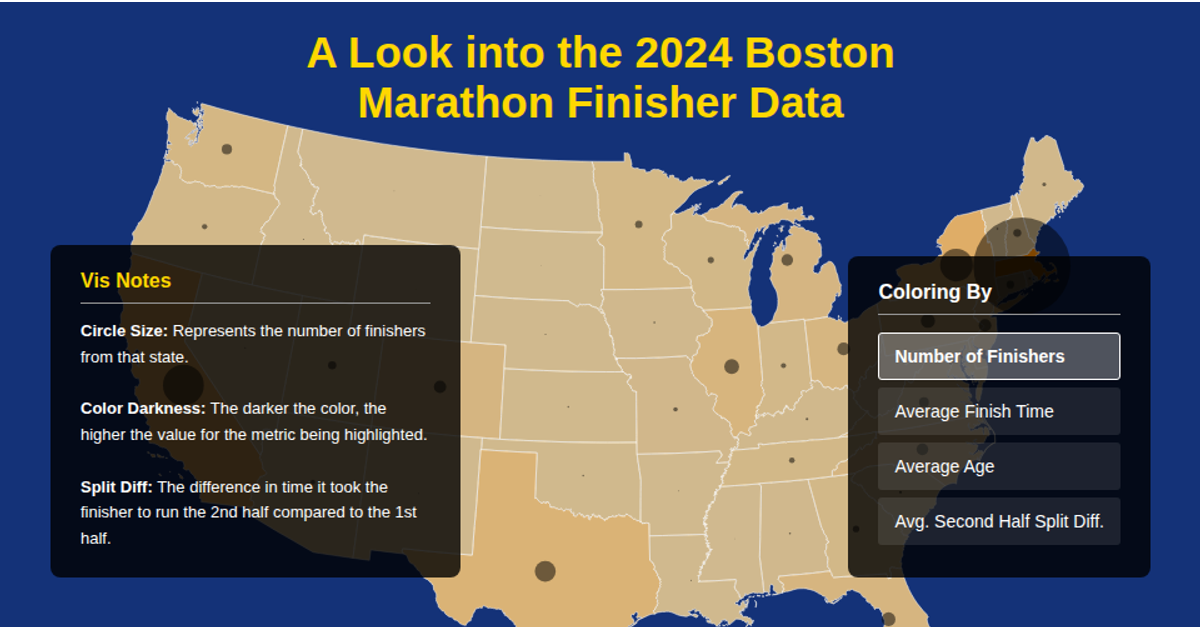
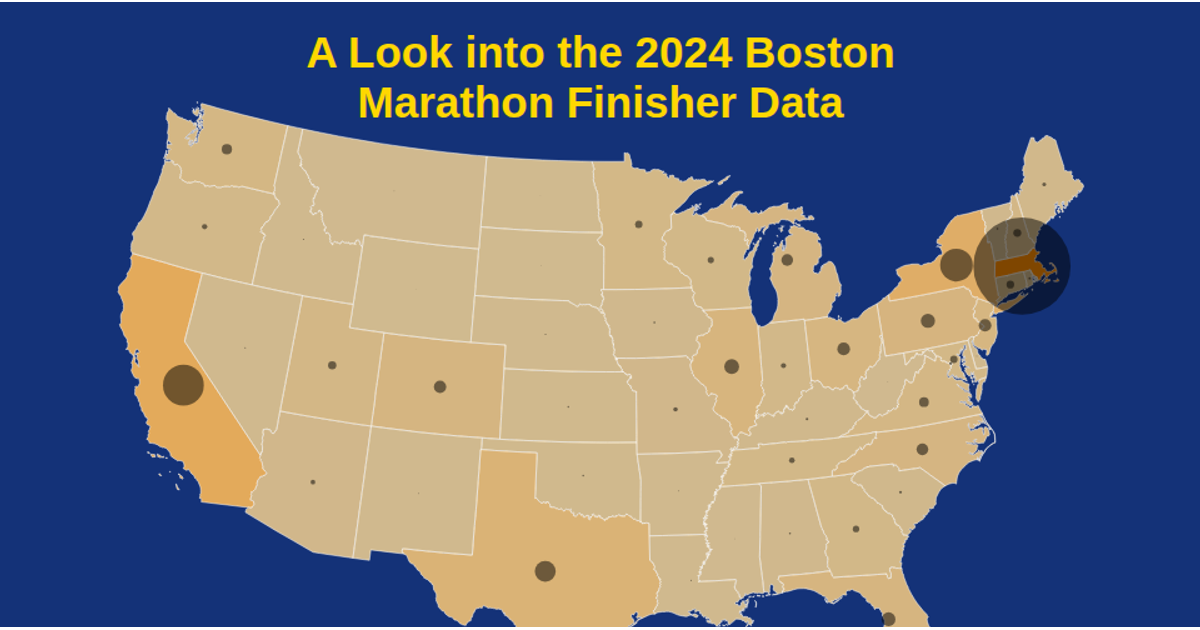
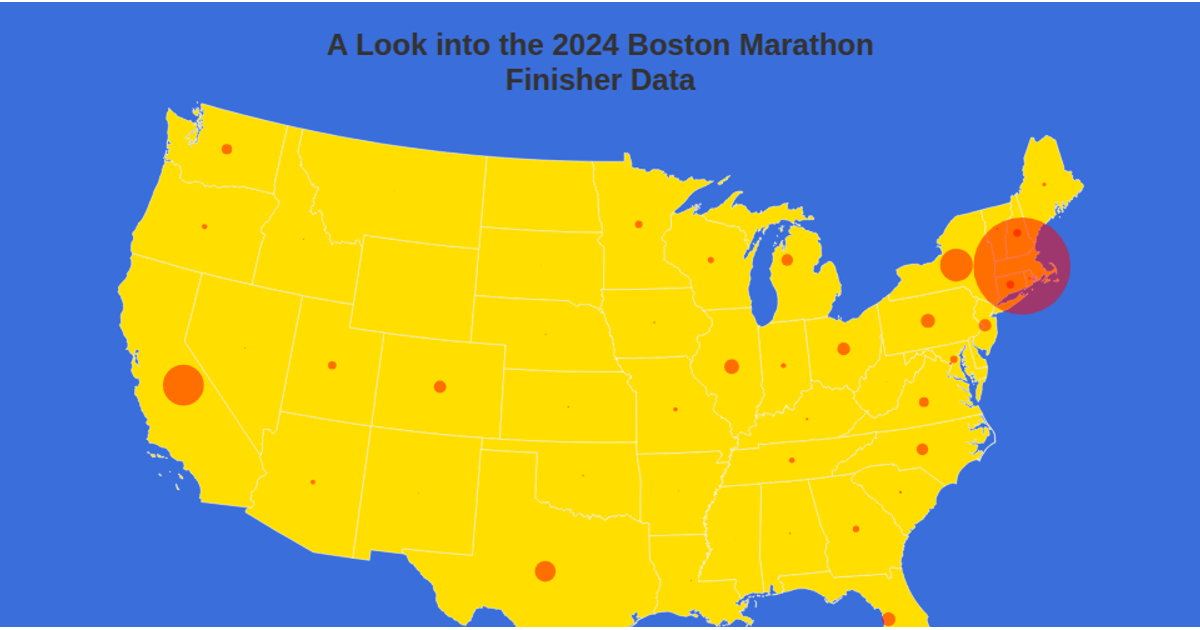
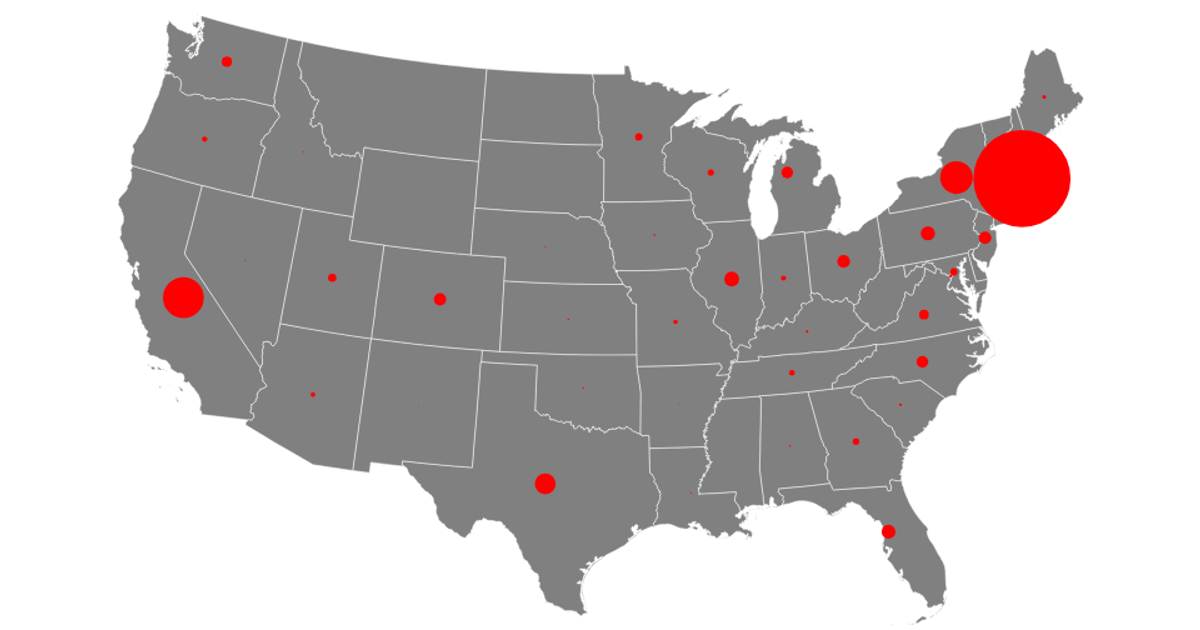
This interactive visualization displays 2024 Boston Marathon finisher data aggregated by U.S. state on an Albers equal-area projection map. Users can toggle between four coloring metrics—number of finishers, average finish time, average age, and average second-half split difference—with darker state colors indicating higher values. Circle size encodes the finisher count per state. Built with D3.js and topojson-client, it loads state boundaries from the us-atlas TopoJSON, parses CSV data via d3.csvParse, and renders geographic paths using d3.geoPath and a tooltip on hover.
AI-generated descriptionMIT Licensed


Comments
Sign in to join the discussion.