🌍 Public
Final Project Progress 1
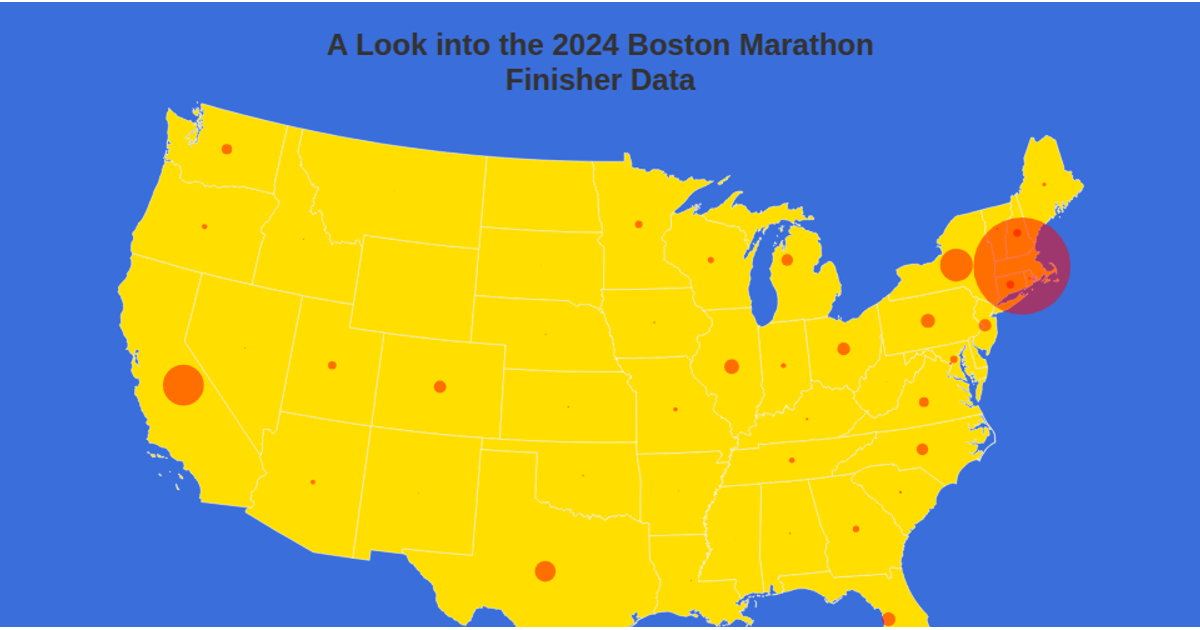
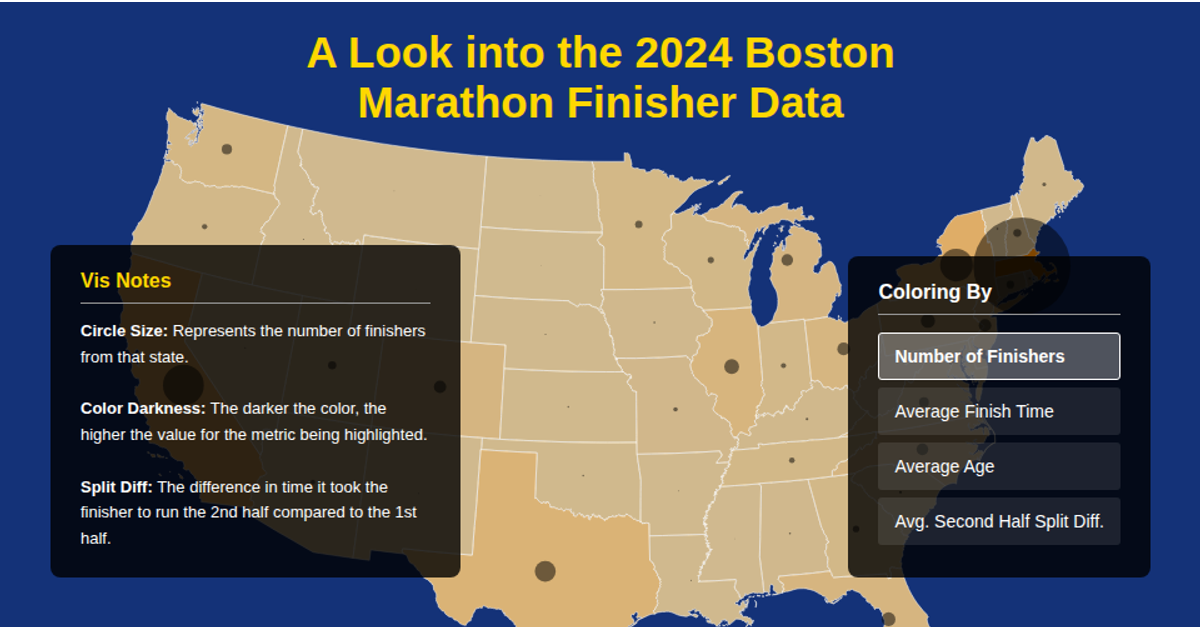
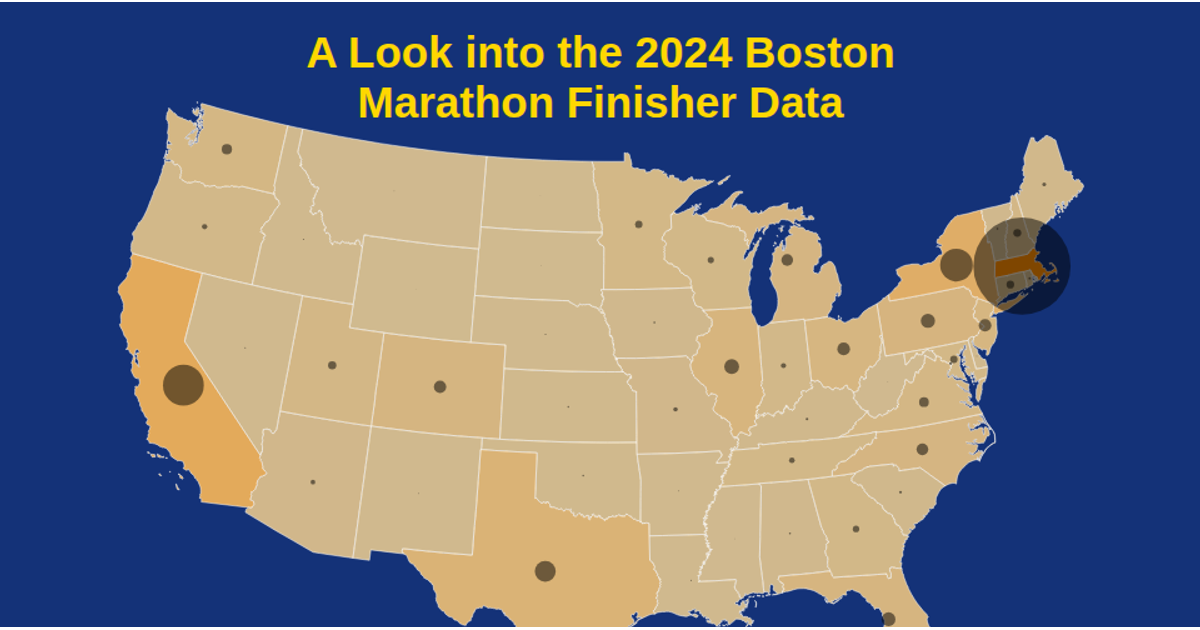
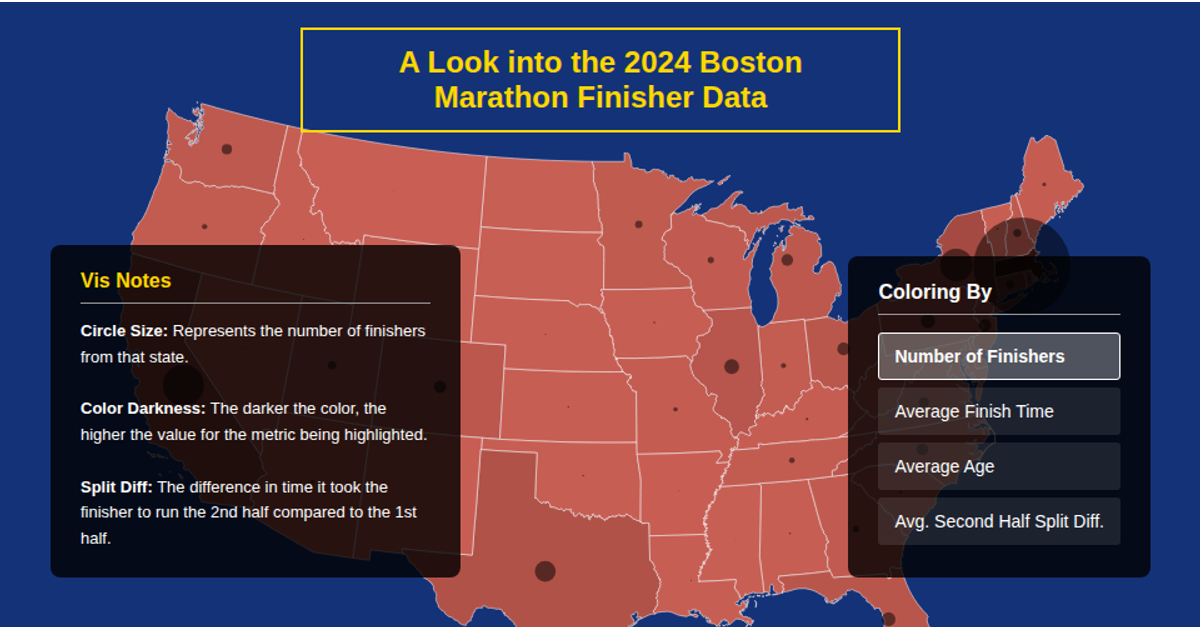
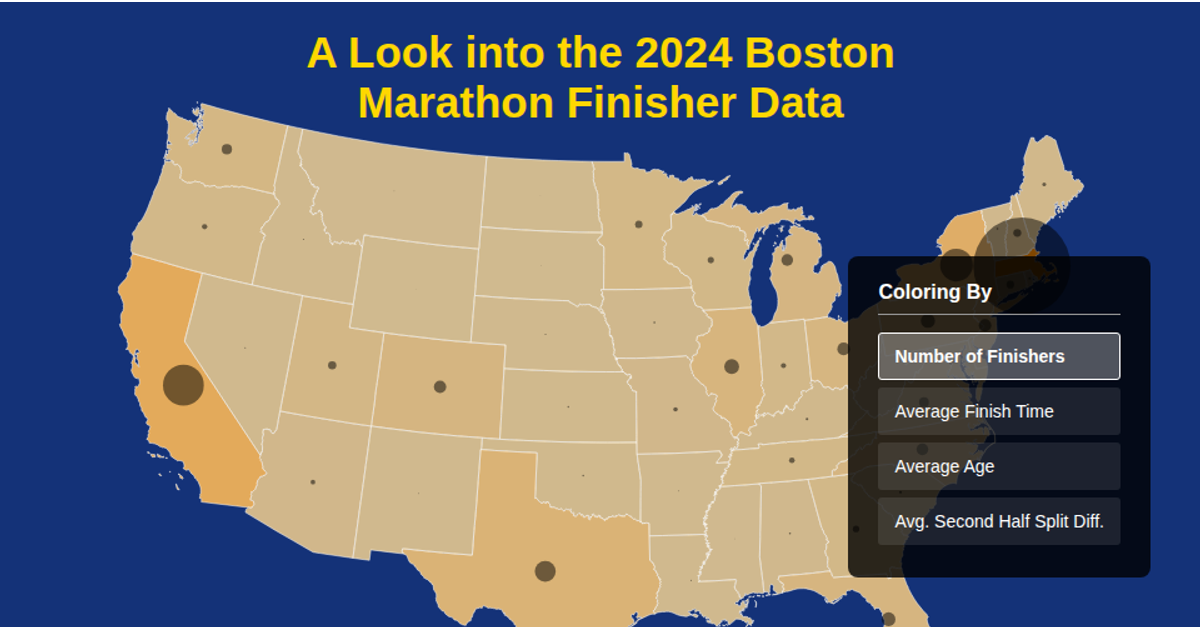
This interactive map of the United States visualizes the geographic distribution of marathon finishers by state. State boundaries are rendered as grey paths that turn green on hover, while red circles positioned at each state’s center scale in radius based on the total number of finishers recorded. The visualization loads US Atlas TopoJSON for state polygons, alongside CSV files listing state centers and finisher records. It uses d3.geoAlbers and d3.geoPath for projection and rendering, with d3.csvParse and topojson-client for data processing.
AI-generated descriptionMIT Licensed


Comments
Sign in to join the discussion.