🌍 Public
Final Project Progress 2
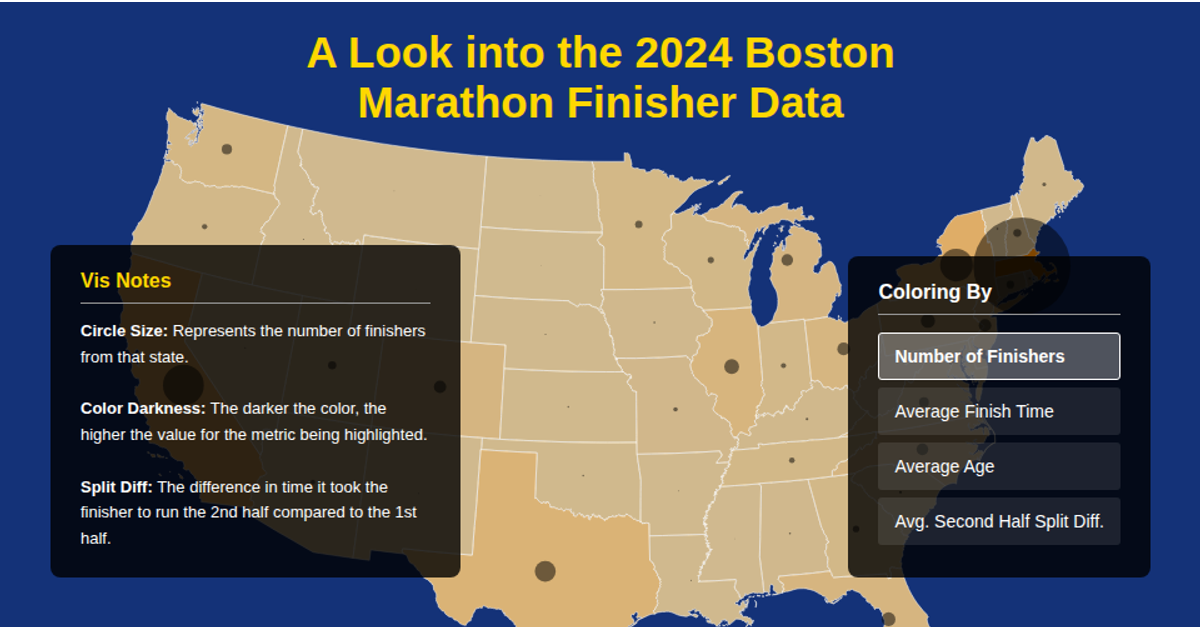
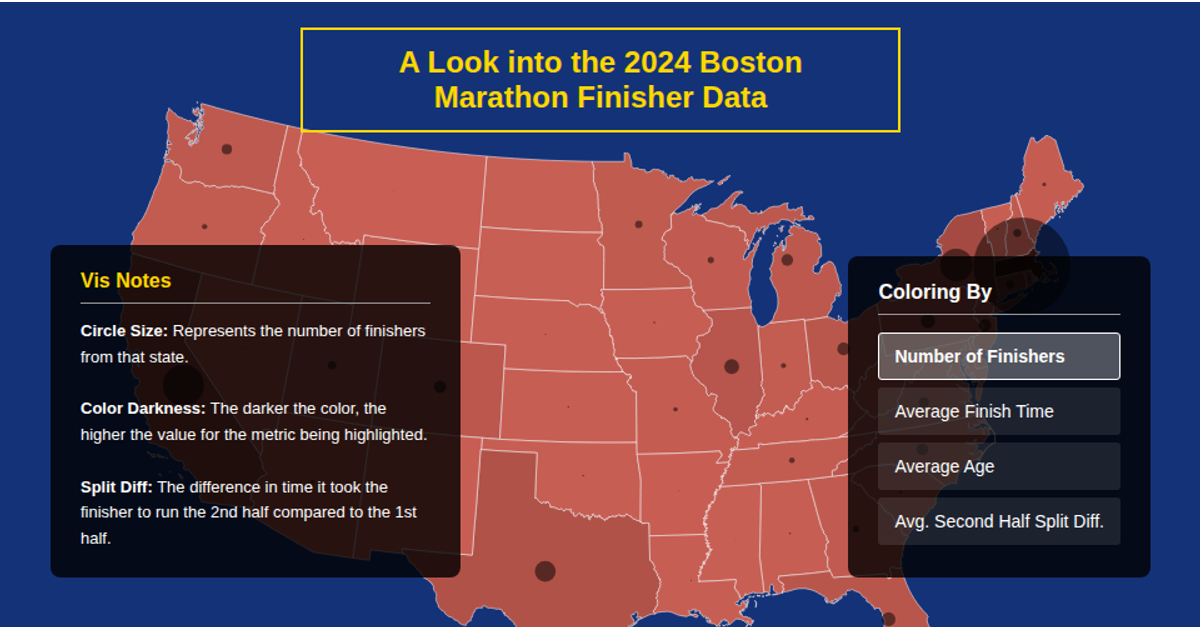
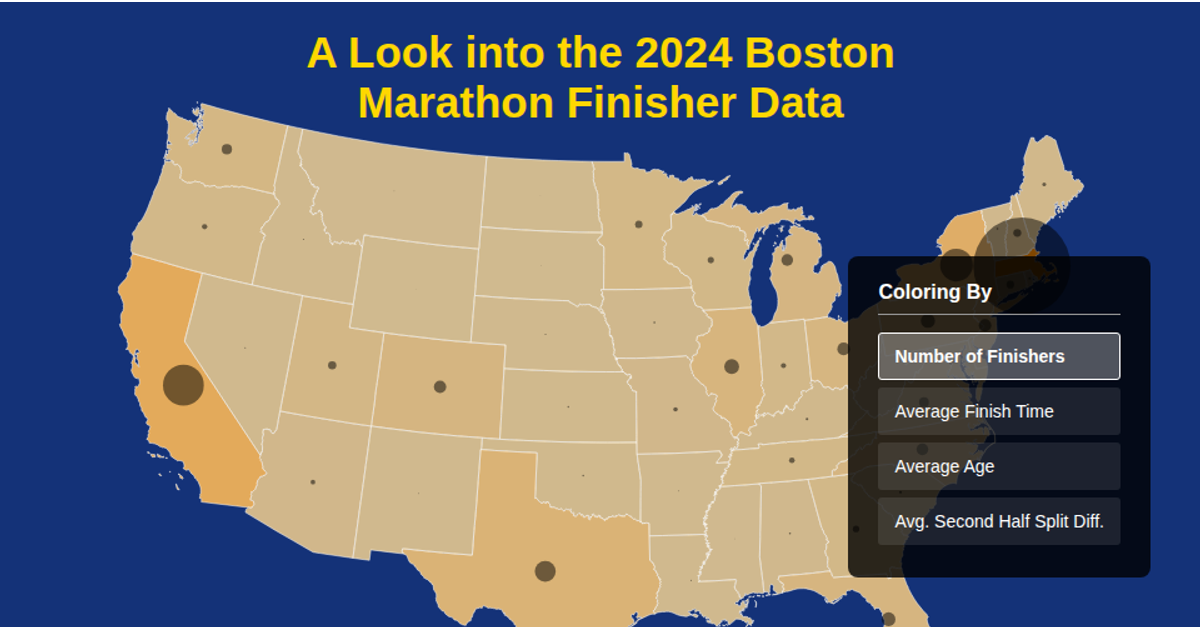
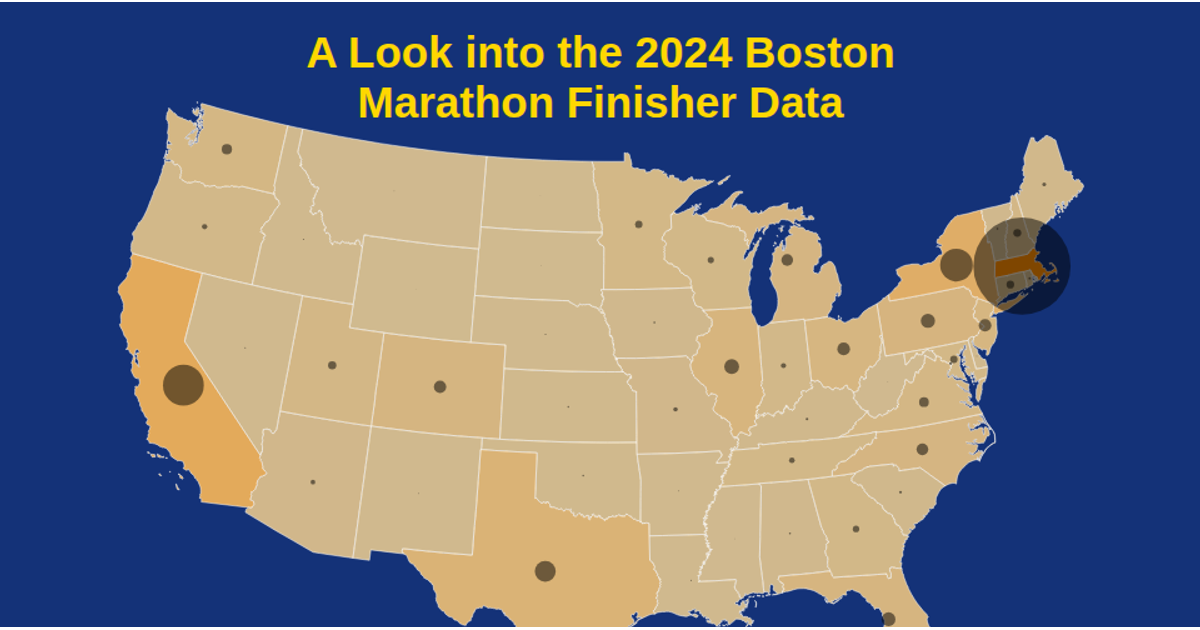
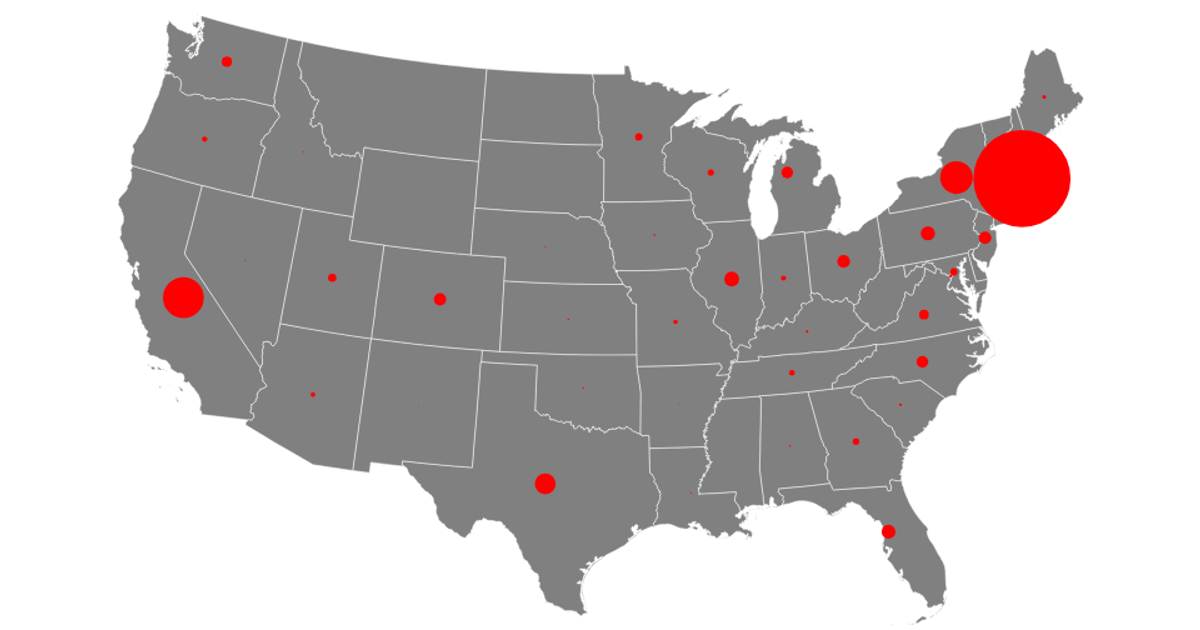
This visualization displays finisher counts from the 2024 Boston Marathon on a U.S. state map. It uses a static Albers projection to render state boundaries, with red circles sized relative to each state’s finisher count. Hovering over a state highlights it in green and shows a tooltip with the state name and total finishers. The data is loaded from CSV and TopoJSON sources, parsed with `d3.csvParse`, and processed with `topojson-client` alongside `d3.geoPath` and `d3.geoAlbers`.
AI-generated descriptionMIT Licensed


Comments
Sign in to join the discussion.