🌍 Public
ATS - Variable driven multi plot
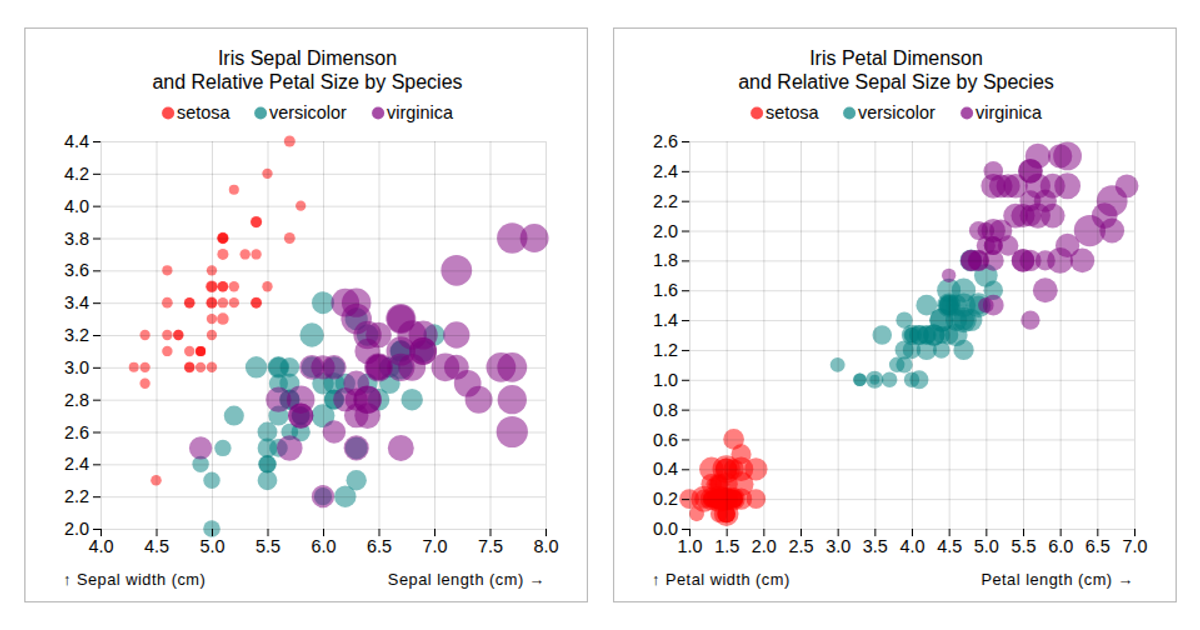
A dashboard of four synchronized scatterplots explores the Iris dataset, each plot pairing different sepal and petal dimensions while encoding a third measurement as point radius. D3.js scales map data values to pixel positions and sizes, with ordinal coloring distinguishing the three species. Variables drive each plot’s configuration, setting axes, titles, and dimensions dynamically. The SVG-based visualization renders data from the local iris.csv file, with shared legends and colored borders framing each quadrant.
AI-generated descriptionA reproduction of a Sol LeWitt art piece.
MIT Licensed


Comments
Sign in to join the discussion.