🌍 Public
ATS - Scatter Plot
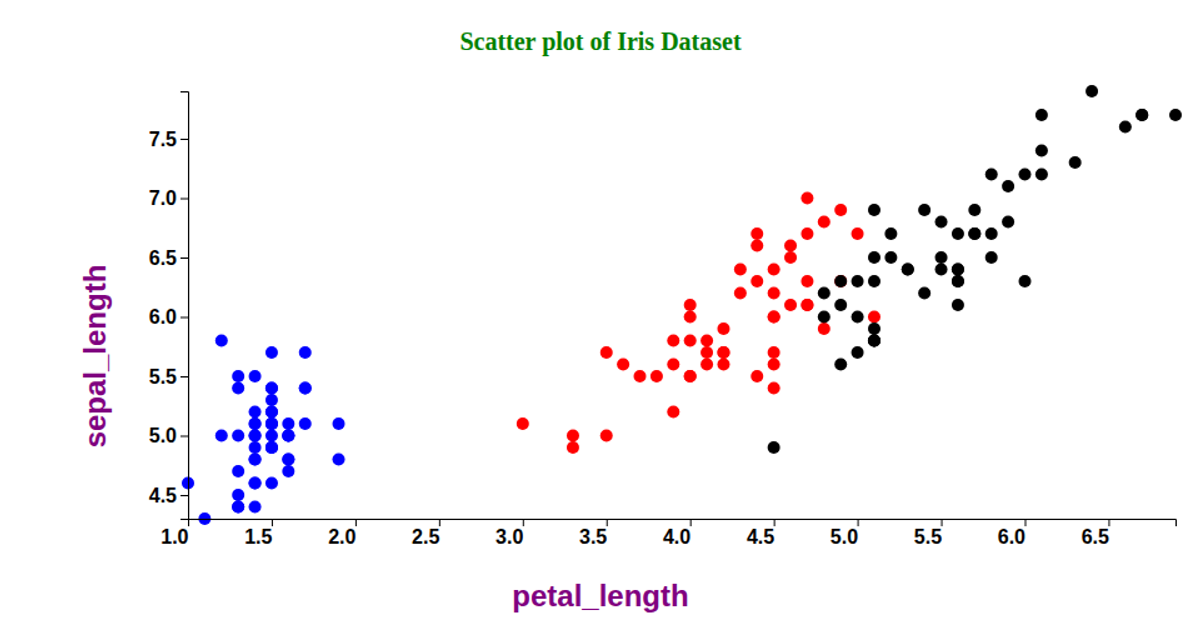
This scatter plot visualizes the Iris dataset, showing sepal length and width for three iris species while encoding the relative petal size (petal length multiplied by petal width) as the radius of each circle. The visualization is built with D3.js, using `d3.select`, `d3.csv`, `d3.scaleLinear` for x, y, and radius mappings, and `d3.scaleOrdinal` for color coding by species, with a legend and grid lines.
AI-generated descriptionA reproduction of a Sol LeWitt art piece.
MIT Licensed



Comments
Sign in to join the discussion.