🌍 Public
ATS Dual Scatterplot
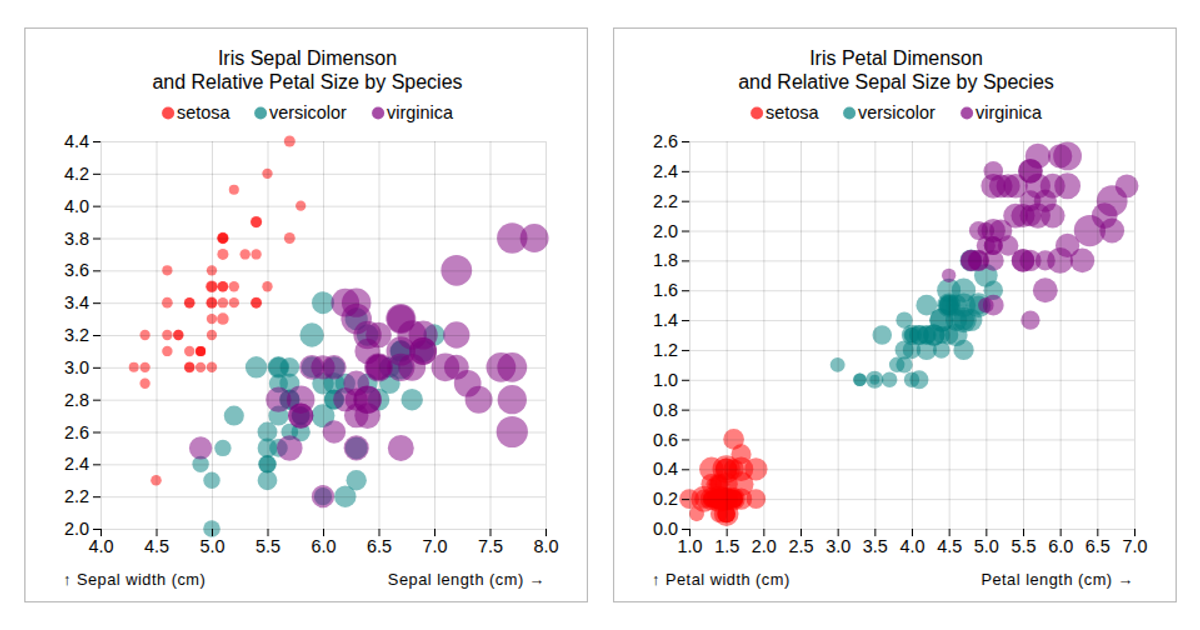
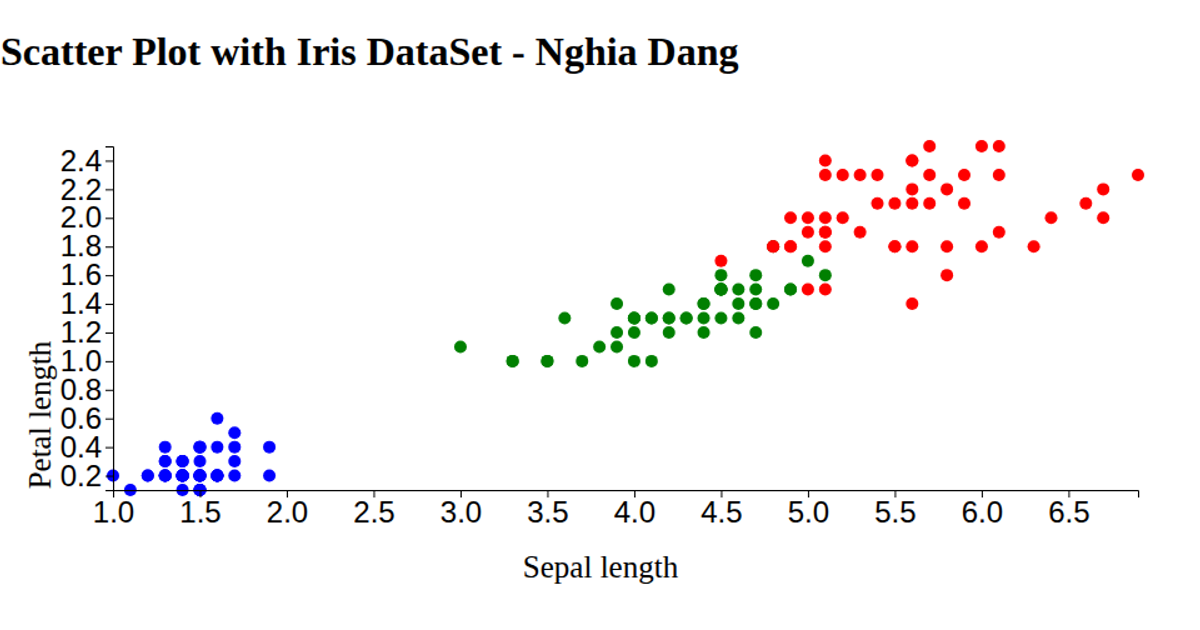
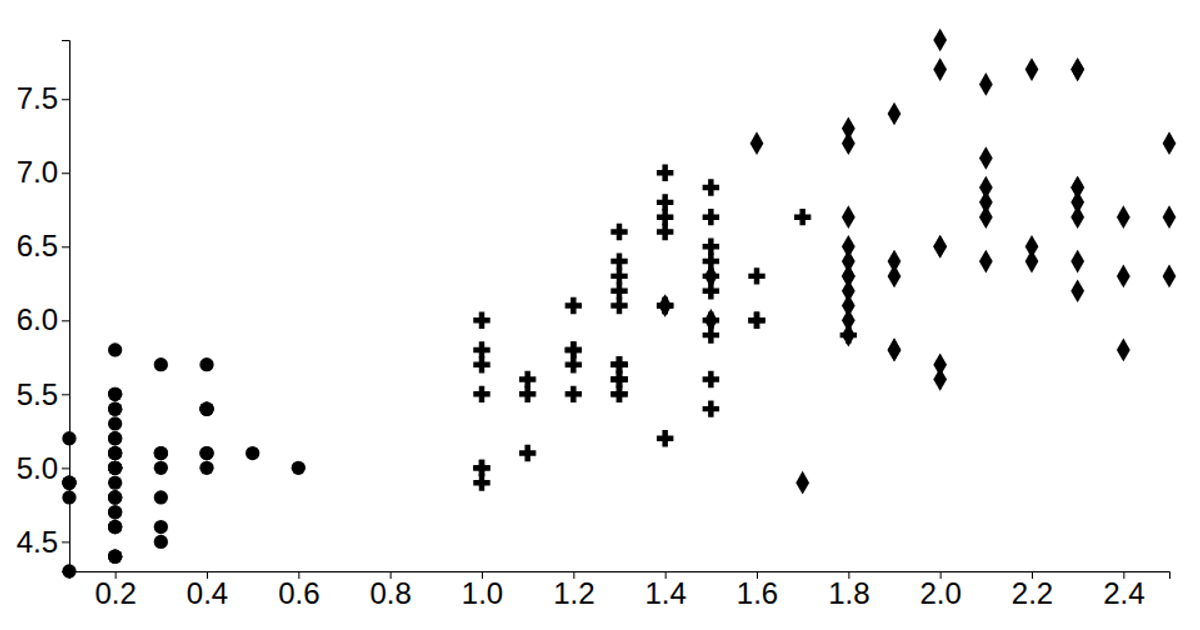
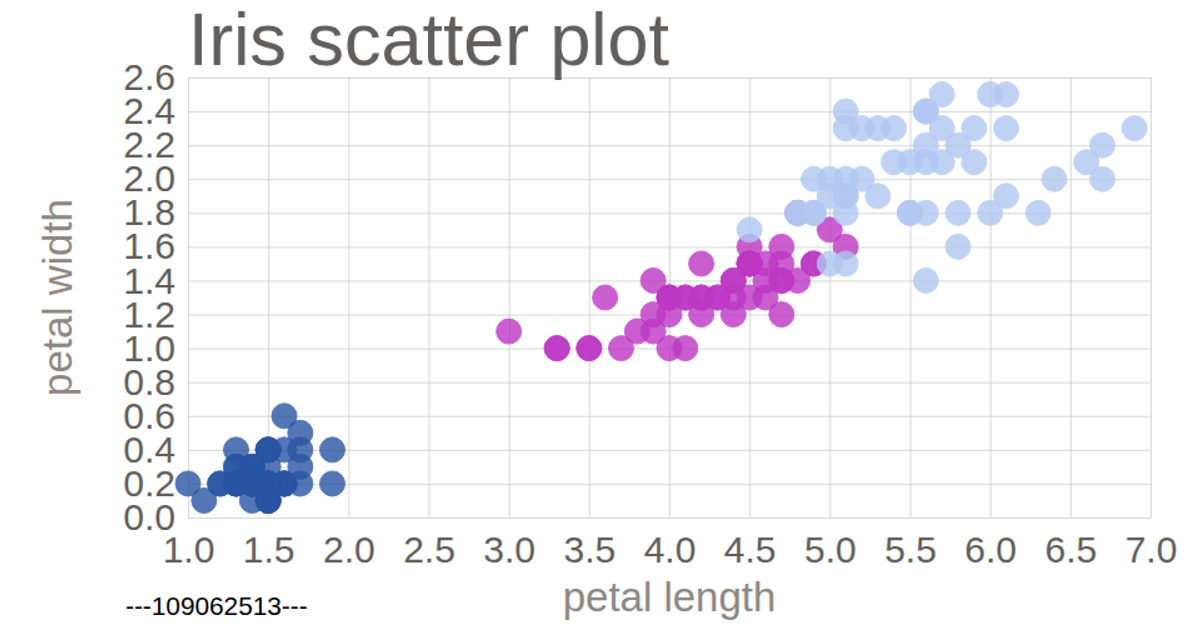
The ATS Dual Scatterplot presents two side-by-side scatter plots visualizing the Iris dataset. The left plot maps sepal length against sepal width, while the right plot maps petal length against petal width, with point sizes encoding the product of the other two dimensions. Both plots color points by species. The visualization uses custom D3 code, including `d3.scaleLinear`, `d3.extent`, and `d3.symbol`, to render SVG circles, axes, grids, and legends. The `scatterPlot` function is a reusable module, and data loading uses `d3.csv`.
AI-generated descriptionMIT Licensed



Comments
Sign in to join the discussion.