🌍 Public
Ploting points
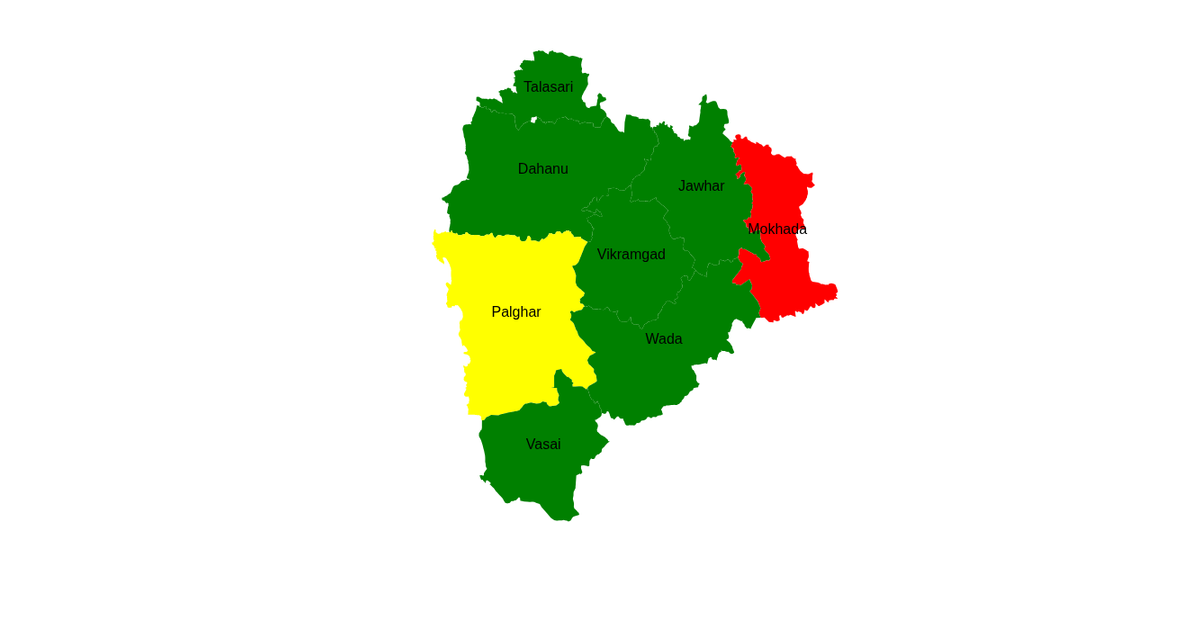
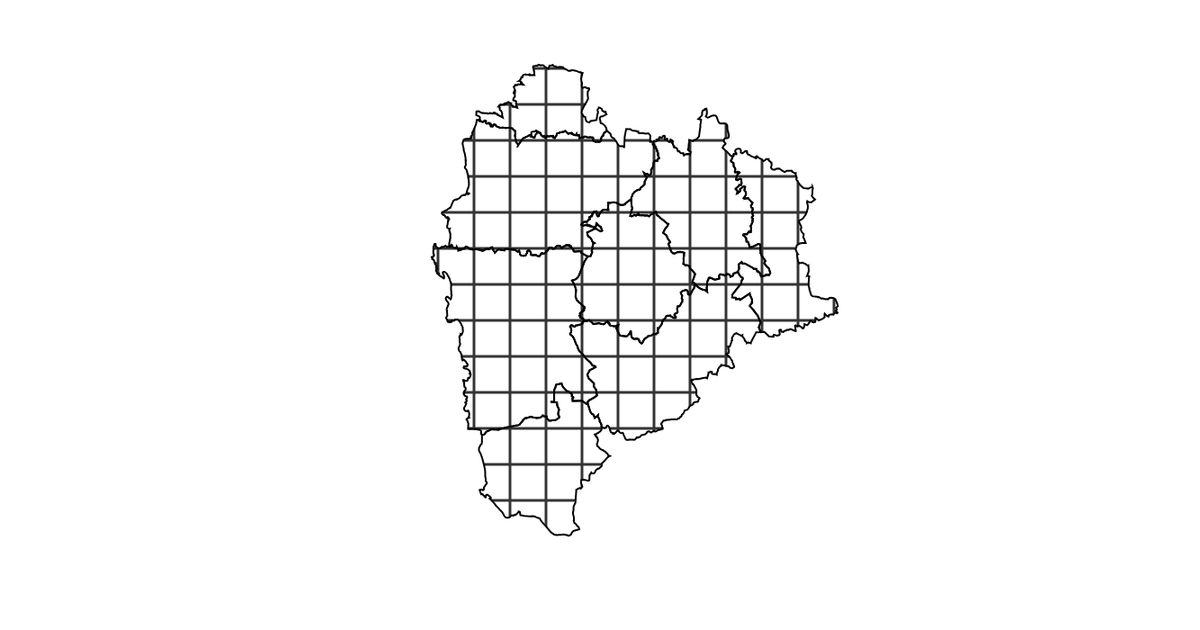
This example plots point data from a GeoJSON file onto a map of the Palghar district using D3.js. Each point represents an Anganwadi center, rendered as a small circle positioned with the Mercator projection. The code uses D3 v5 with `geoMercator`, `geoPath`, and `selectAll("circle")` to visualize the spatial distribution of the centers. The map is rendered as SVG, and the points are drawn directly from the `awc.json` feature collection.
AI-generated descriptionMIT Licensed



Comments
Sign in to join the discussion.