Covid countrywise total cases on 1st May vs 31 st May
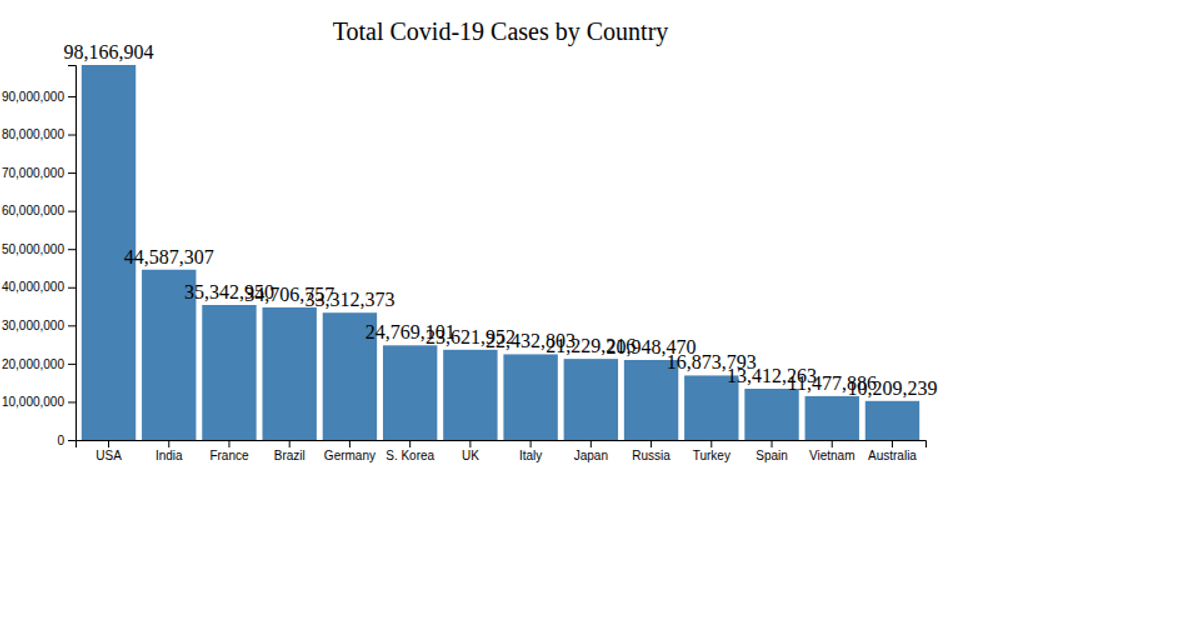
This visualization compares COVID-19 total cases across countries on May 1st against May 31st, 2020, using two horizontal bar charts stacked vertically. It highlights which nations had high case counts at the month’s start and end, filtering to countries with over 20,000 cases. The charts are built with the Vega-Lite API, which compiles specifications to Vega, and data is loaded from a CSV file hosted on GitHub using d3.csv. The code uses vl.vconcat to align the two plots and vl.markBar for the bars, with x- and y-encodings sorting by case count.
AI-generated descriptionA visualization constructed using the vega-lite-api.
The data shown here comes from the Kaggle: Corona virus cases.
This visualization shows which change in total cases of covid 19, between 1st May 2020 and 31st May 2020. Which countries had high counts at the start of month and at the end of month?




Comments
Sign in to join the discussion.