A visualization constructed using the vega-lite-api.
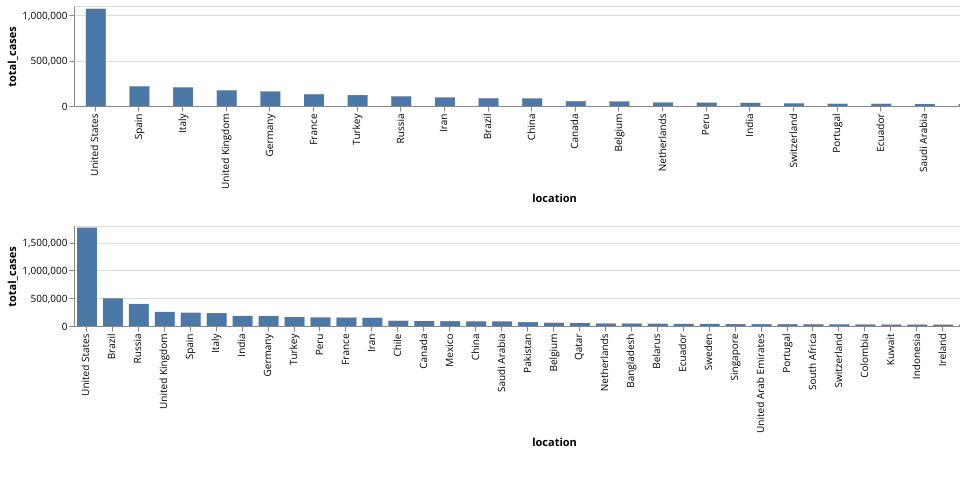
The data shown here comes from the Kaggle: Corona virus cases.
This visualization shows which change in total cases of covid 19, between 1st May 2020 and 31st May 2020. Which countries had high counts at the start of month and at the end of month?
MIT Licensed