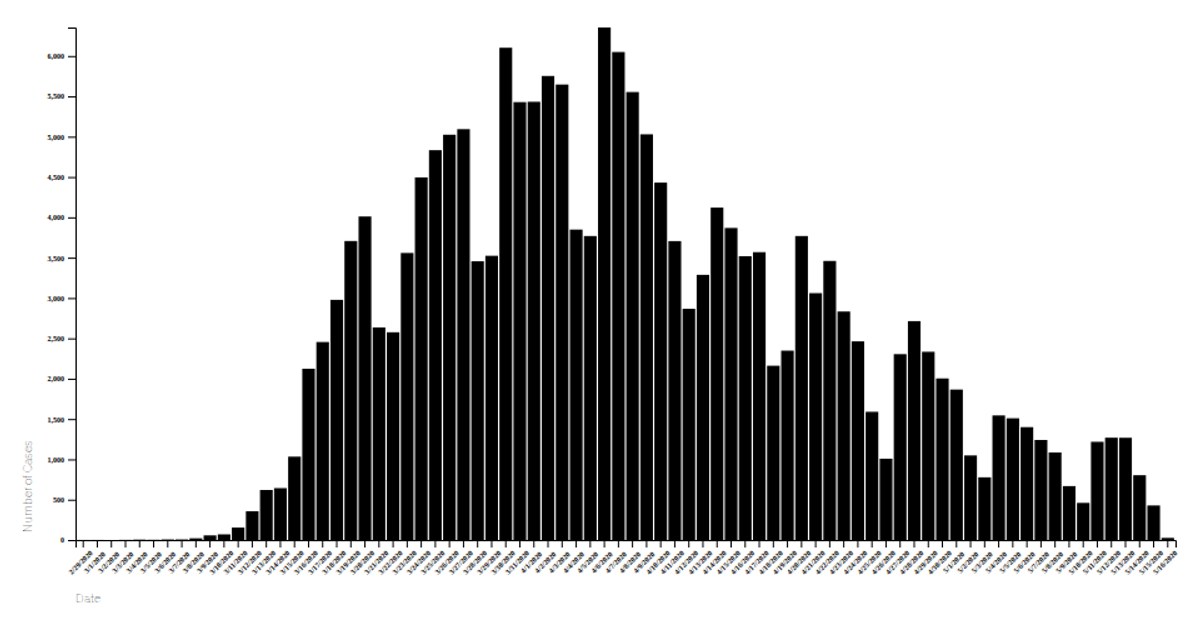
Covid May 2020: Date Vs New Cases countrywise
This visualization tracks daily new COVID-19 cases per country during May 2020, with each country rendered as a colored line over time. The data comes from a Kaggle-hosted CSV and is loaded using `d3.csv` via the `getData` function. The chart is built with the Vega-Lite API, calling `vl.markLine()` with temporal x-axis and quantitative y-axis encodings, while country names drive the color channel. Tooltips display exact case counts and locations. The visualization uses vega-lite-api’s `register` method with vega and vega-lite, and renders as an SVG fitted to the viewport.
AI-generated descriptionA visualization constructed using the vega-lite-api.
The data shown here comes from the Kaggle: Corona virus cases.
This visualization shows which contries had how many new Covid cases daily in month of May 2020 for each country




Comments
Sign in to join the discussion.