🌍 Public
Chloropeth Map
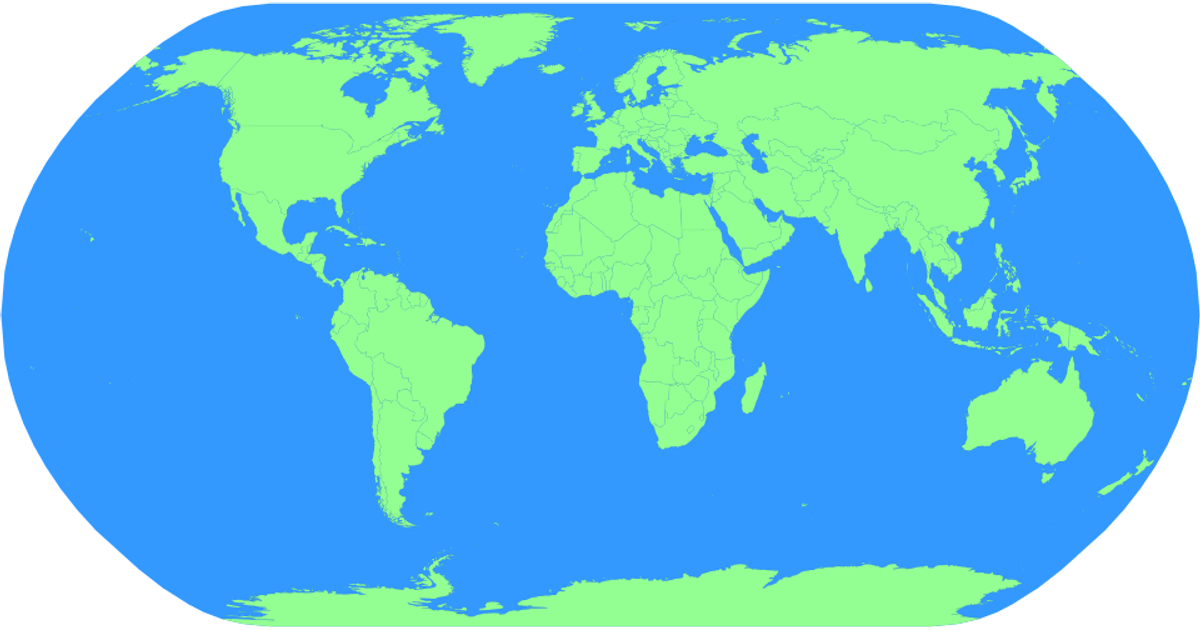
This example displays a natural Earth projection chloropleth map of world countries, rendered as interactive SVG paths. The visualization uses d3-geoProjection and d3.geoPath to draw country boundaries and a blue sphere backdrop, loaded from TopoJSON and TSV data via the world-atlas package. Pan and zoom interactions are enabled through d3.zoom, while hover states change country fill colors from light green to dark green.
AI-generated descriptionA bare minimum HTML page.
See also React Starter.
MIT Licensed




Comments
Sign in to join the discussion.