🌍 Public
area chart
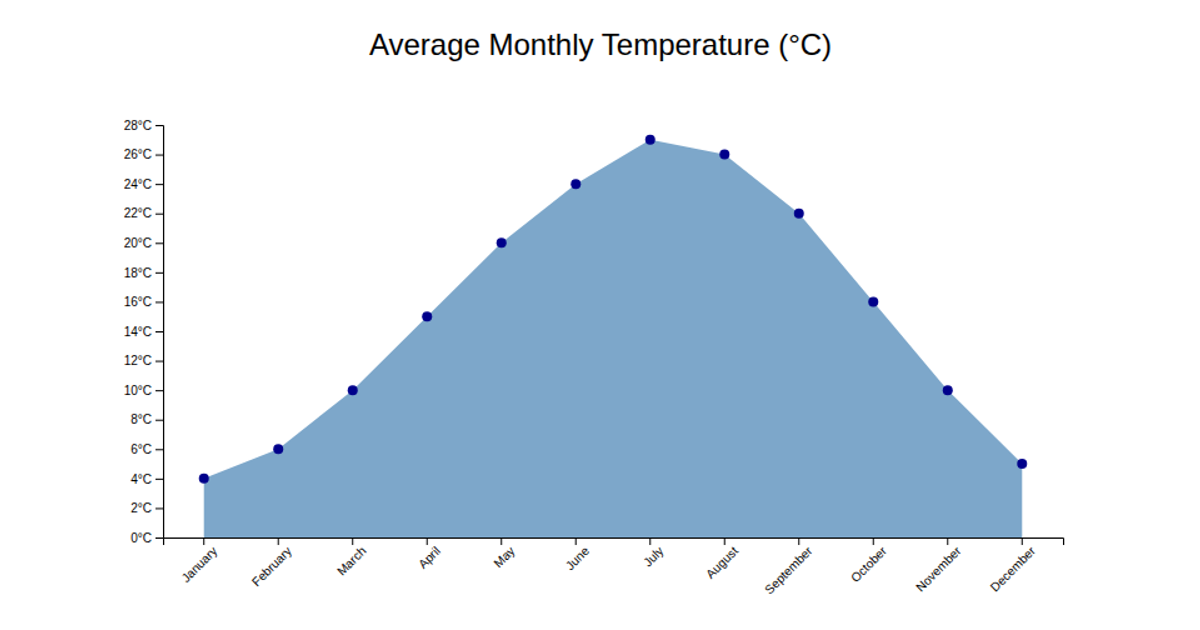
This area chart displays the average monthly temperature in California from 1950 to 2022, using a steel-blue filled region to show temperature trends over time. The visualization loads CSV data from a GitHub gist and renders an SVG with D3 v5, employing `d3.area`, `d3.scaleLinear`, `d3.axisBottom`, and `d3.axisLeft`. Axes are labeled for year and temperature in Fahrenheit, with integer year formatting. The chart filters the dataset by state and sorts entries chronologically before plotting.
AI-generated descriptionAn example showing the capabilities of VizHub:
- Loads D3 via UNPKG.
- Demonstrates use of
importfrom"d3". - Demonstrates use of
importfrom local ES6 modules.
MIT Licensed






Comments
Sign in to join the discussion.