🌍 Public
Area chart
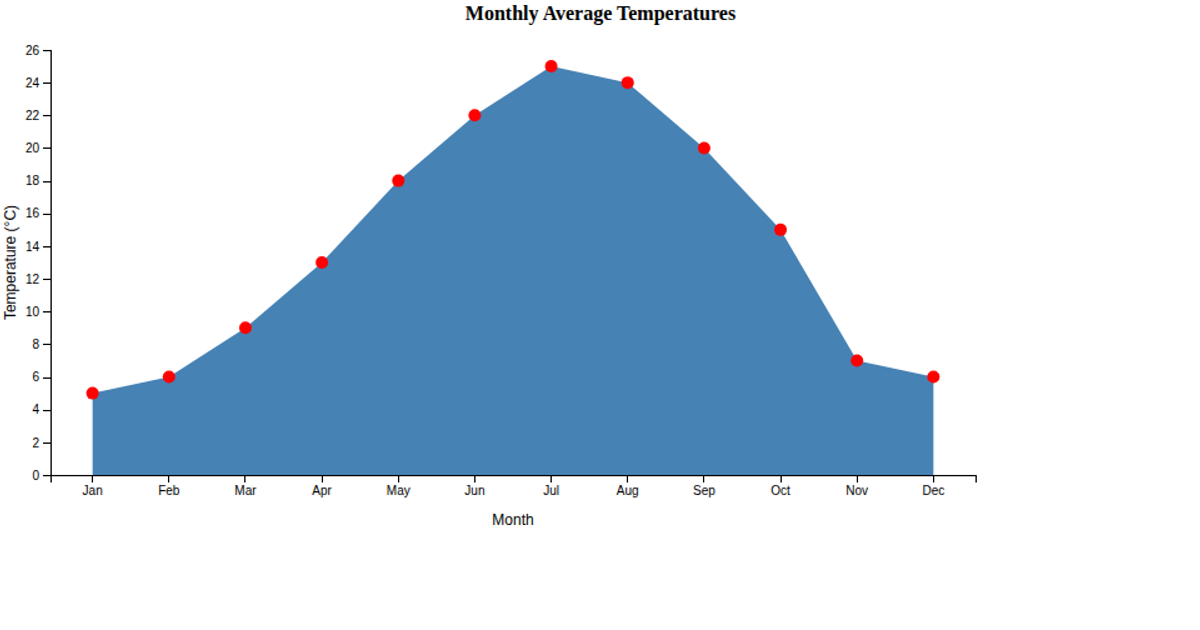
This area chart displays average monthly temperatures in degrees Celsius from a CSV dataset, filling the area beneath the line with semi-transparent steel blue and adding dark blue circles at each data point. Hovering over a circle turns it orange, enlarges it, and reveals a tooltip showing the month and exact temperature. The visualization uses D3 v7 with an SVG rendering approach, employing `d3.area`, `d3.scaleBand`, `d3.scaleLinear`, and `d3.axisBottom` to construct the chart and its axes.
AI-generated descriptionMIT Licensed





Comments
Sign in to join the discussion.