🌍 Public
Area chart
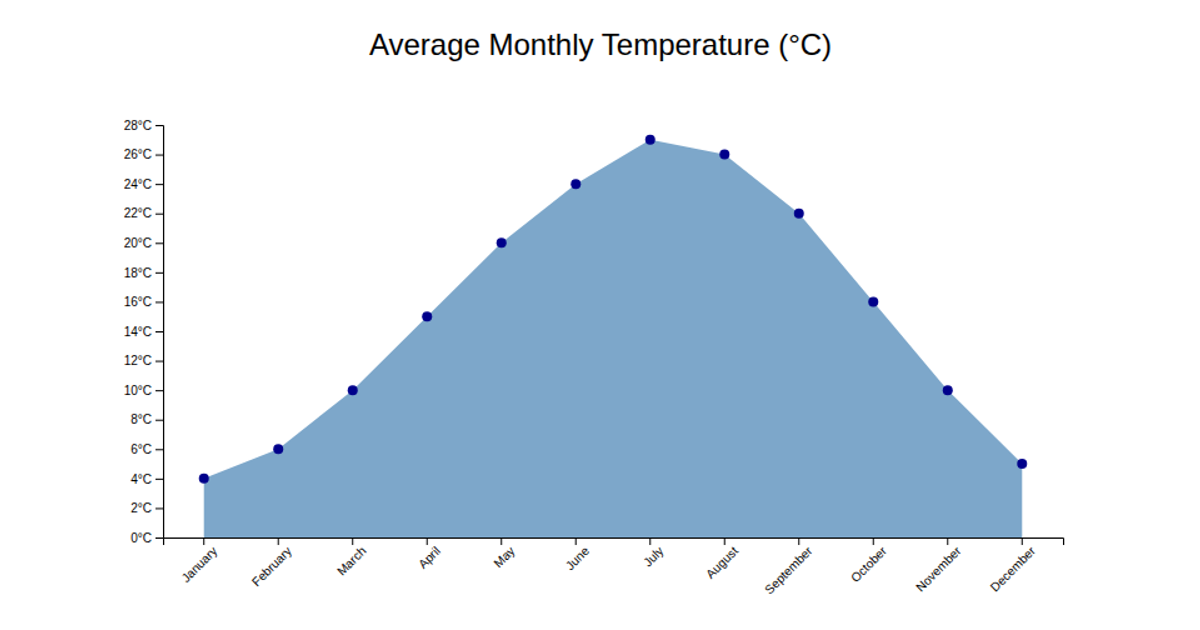
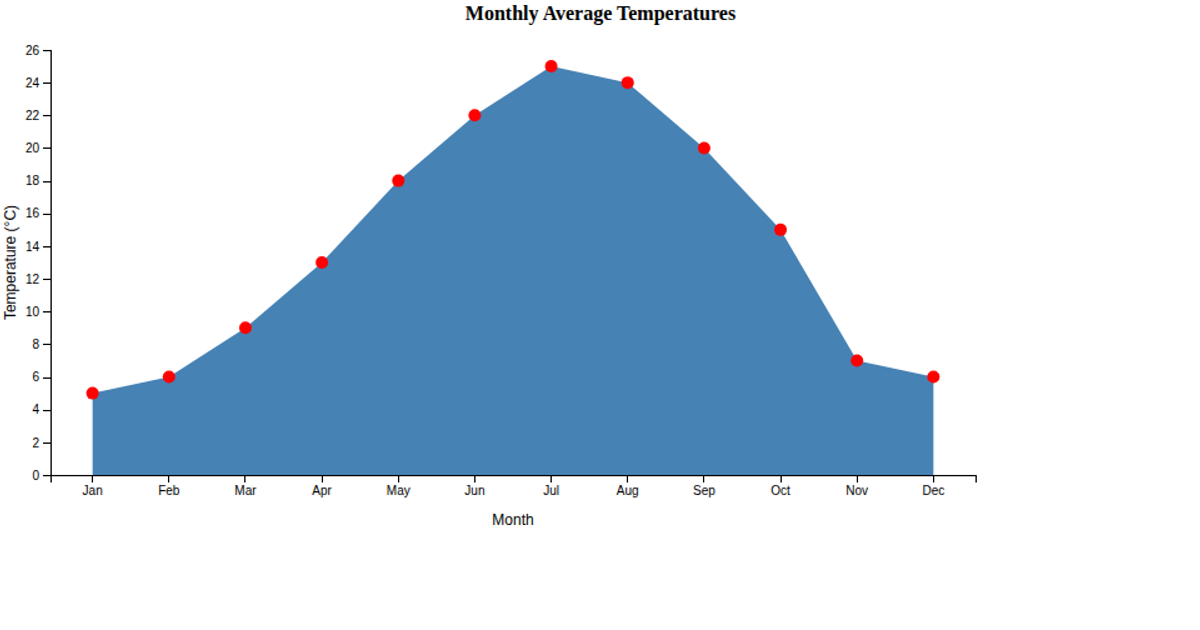
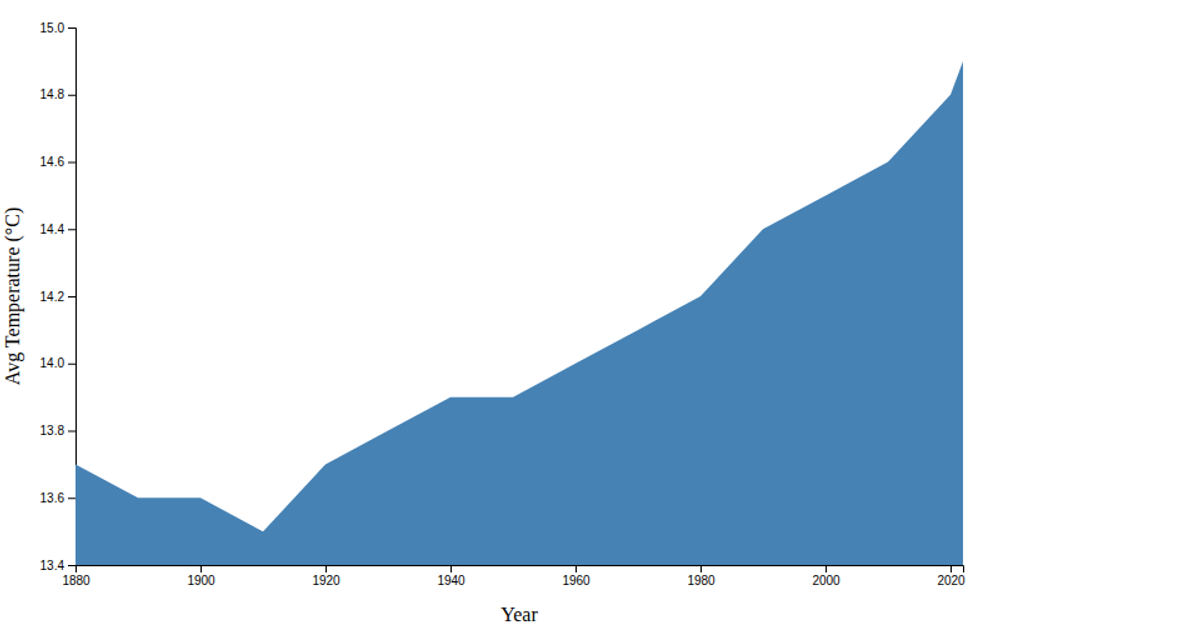
This area chart displays monthly average temperatures across a calendar year, using a filled steelblue region to show temperature trends from January through December. The visualization builds an SVG chart with D3 v6, employing `scaleBand` for the month categories, `scaleLinear` for temperature values, and the `area` generator to create the shaded region. Axis labels are added using `axisBottom` and `axisLeft`, which explicitly identify the months on the x-axis and degrees Celsius on the y-axis. The data originates from hardcoded monthly temperature values in the source code.
AI-generated descriptionA demonstration of reusable scatter plot.
MIT Licensed





Comments
Sign in to join the discussion.