🌍 Public
Question 1 task 1
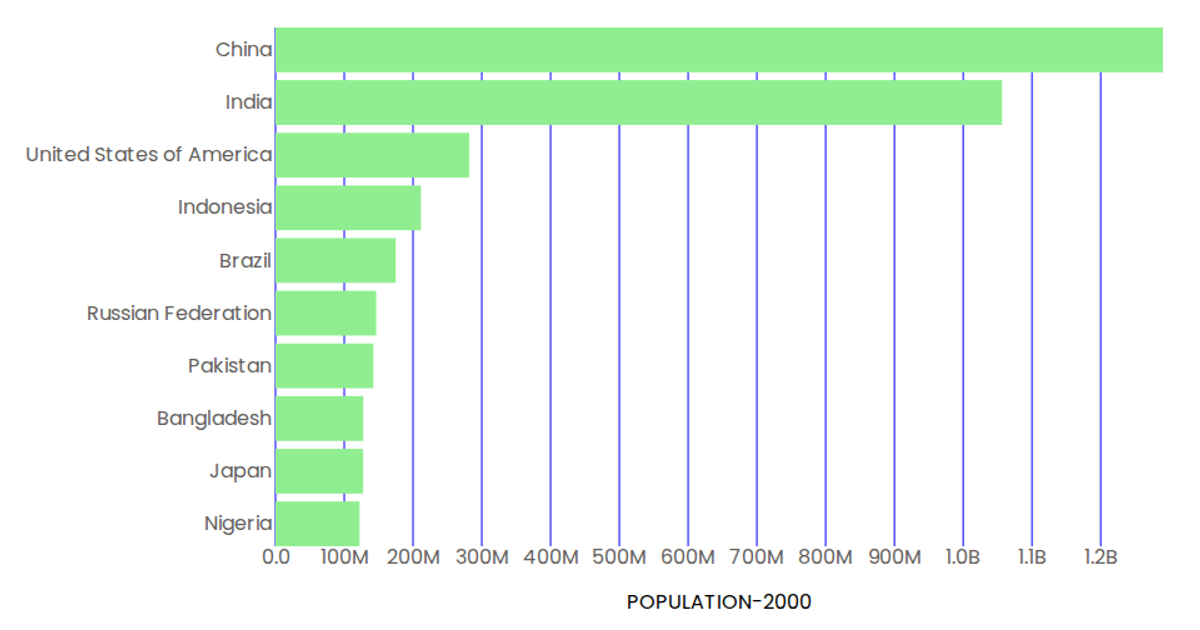
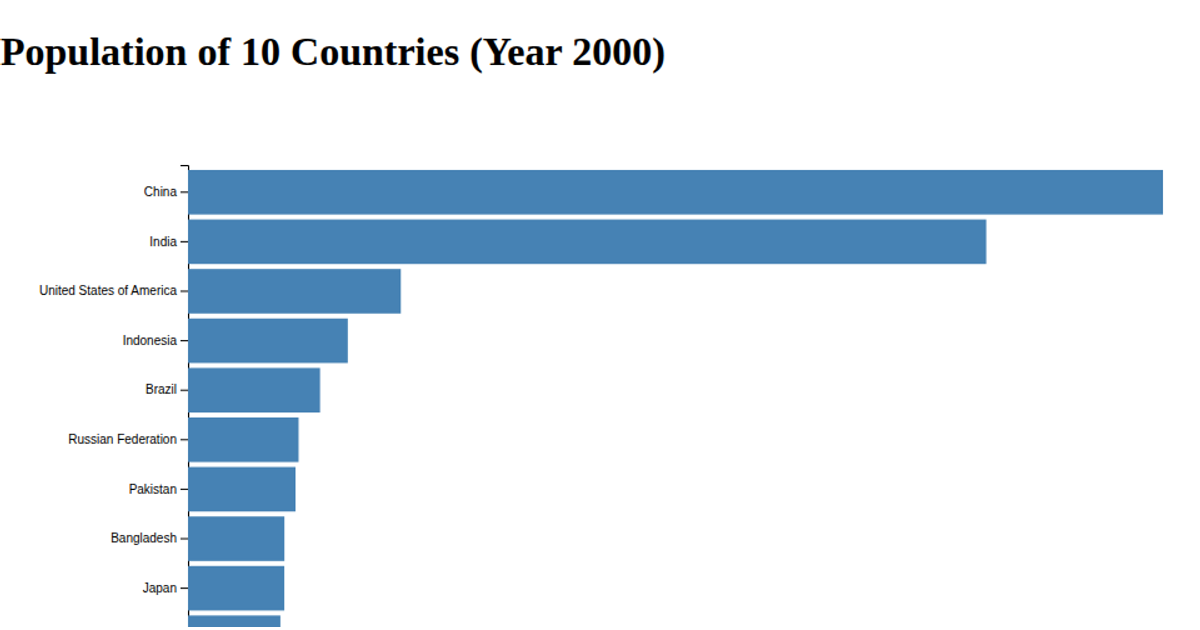
This bar chart displays the top 10 most populous countries in the year 2000, sorted in descending order, with each bar labeled with its corresponding population value. The visualization uses D3 v7 with an SVG rendering approach, employing `d3.scaleBand` and `d3.scaleLinear` to map countries and population values to screen coordinates. Custom axis components (`AxisBottom` and `AxisLeft`) generate rotated tick labels and formatted tick text, while the `Marks` component draws the steel-blue rectangles and value labels. The data is loaded from a CSV file hosted on GitHub, processed in a `useData` function, and filtered to extract the 2000 population column.
AI-generated descriptionMIT Licensed




Comments
Sign in to join the discussion.