🌍 Public
task8_q1.1
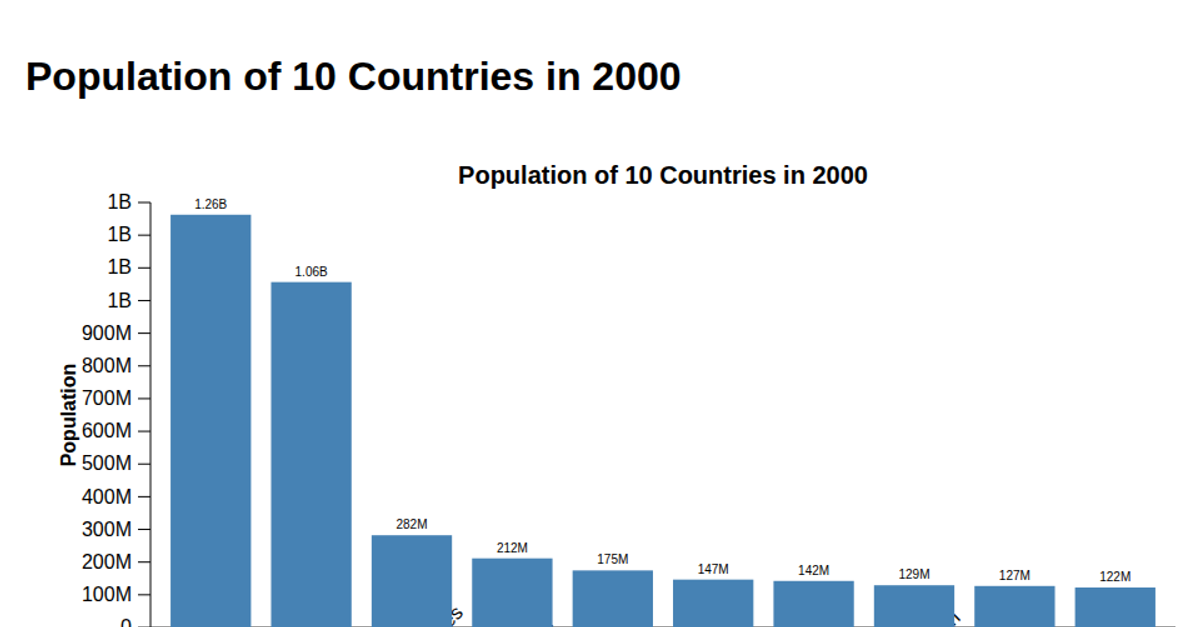
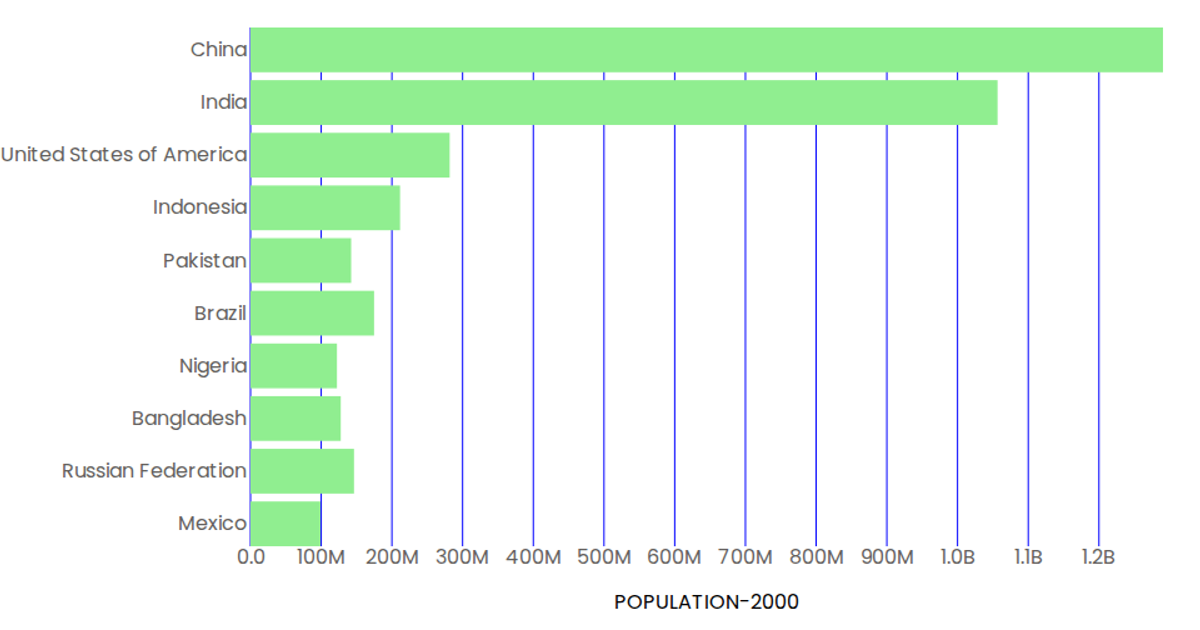
This example displays a bar chart of the top ten most populous countries in the year 2000, sorting the dataset to highlight the largest populations. The visualization is rendered as an SVG using D3.js v7, with bars colored in steel blue that turn orange on hover. The code loads population data via `d3.csv` from a GitHub Gist, filters for the year 2000, and uses `d3.scaleBand` and `d3.scaleLinear` to map countries and population values. Axes are drawn with `d3.axisBottom` and `d3.axisLeft`, including rotated country labels and a rotated y-axis title.
AI-generated descriptionAn example showing the capabilities of VizHub:
- Loads D3 via UNPKG.
- Demonstrates use of
importfrom"d3". - Demonstrates use of
importfrom local ES6 modules.
MIT Licensed




Comments
Sign in to join the discussion.