🌍 Public
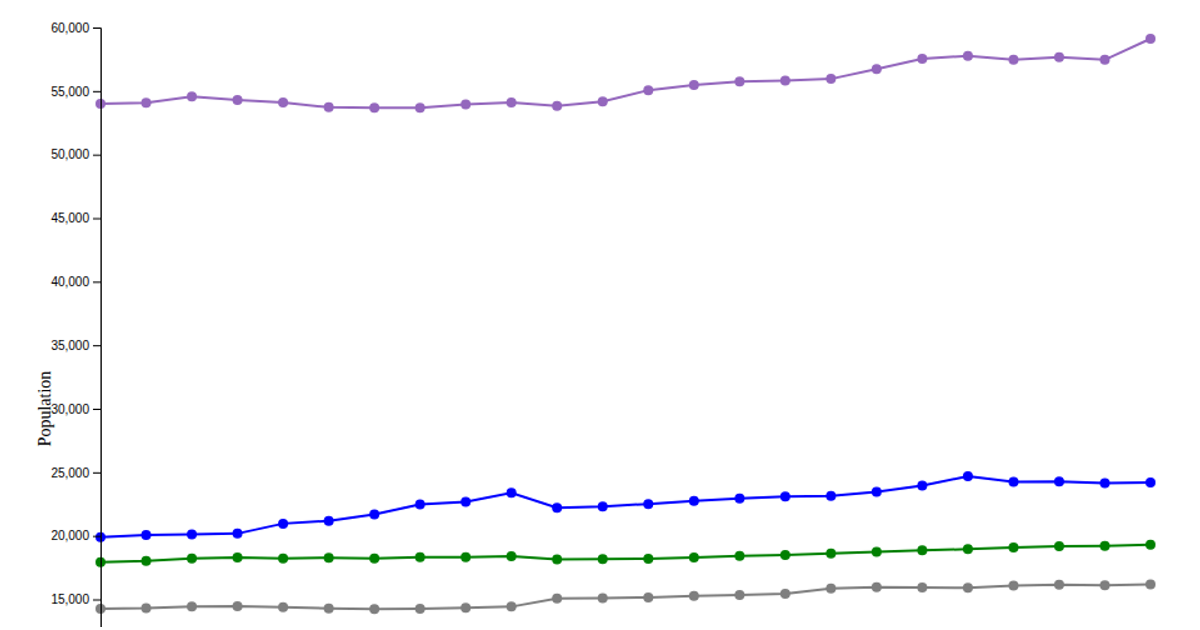
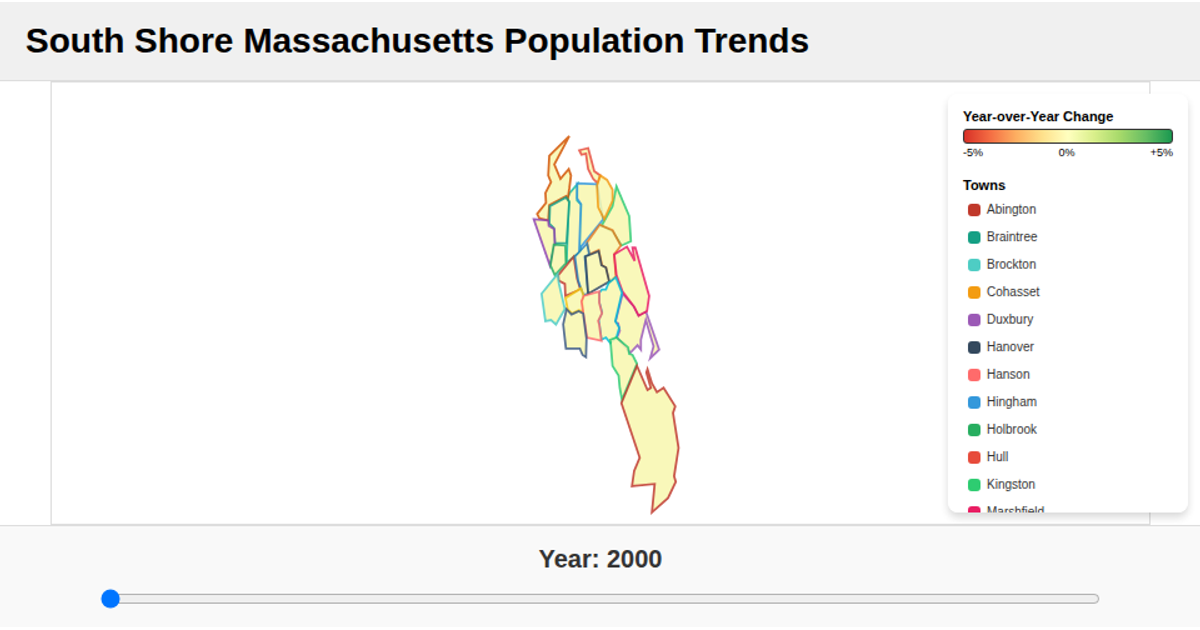
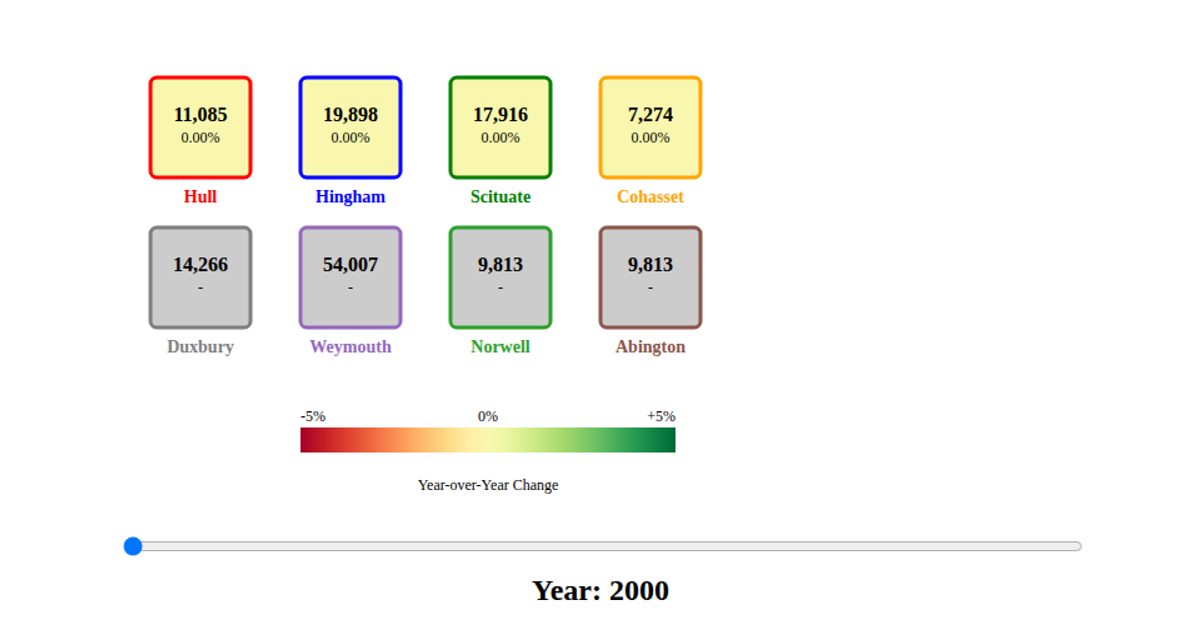
Percent Change Population of Towns on the South Shore Of MA
SSean Thornton
Last edited Sep 24, 2025
Created on Sep 24, 2025
Forked from Population of Towns on the South Shore Of MA
This chart shows year-over-year percent population change from 2001 to 2023 for four Massachusetts towns—Hull, Hingham, Scituate, and Cohasset—using grouped bar charts colored by town, with a legend and axes labeled in percentages. It loads data from CSV files via d3.csv in a React component, parses the values in dataLoader.js, and renders with D3 v7 scaleBand and scaleLinear scales, axisBottom and axisLeft, and enter/merge/exit selections to update bars, legend, and axes.
AI-generated descriptionMIT Licensed


Comments
Sign in to join the discussion.