Sean Thornton Population of Cohasset Scatter Plot with React & D3
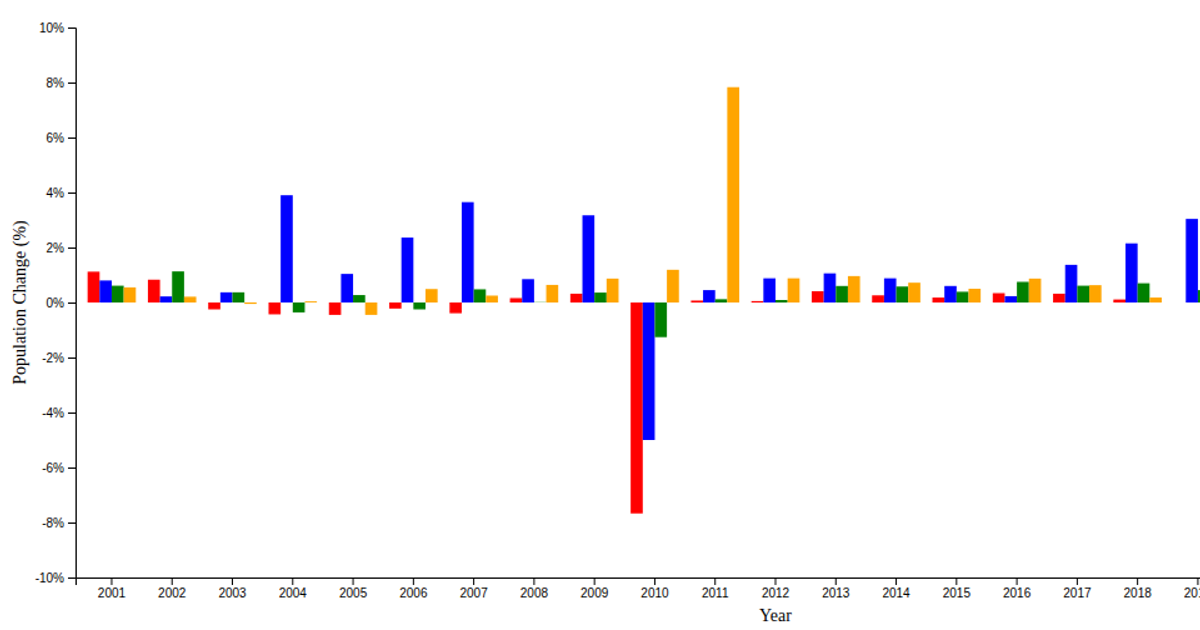
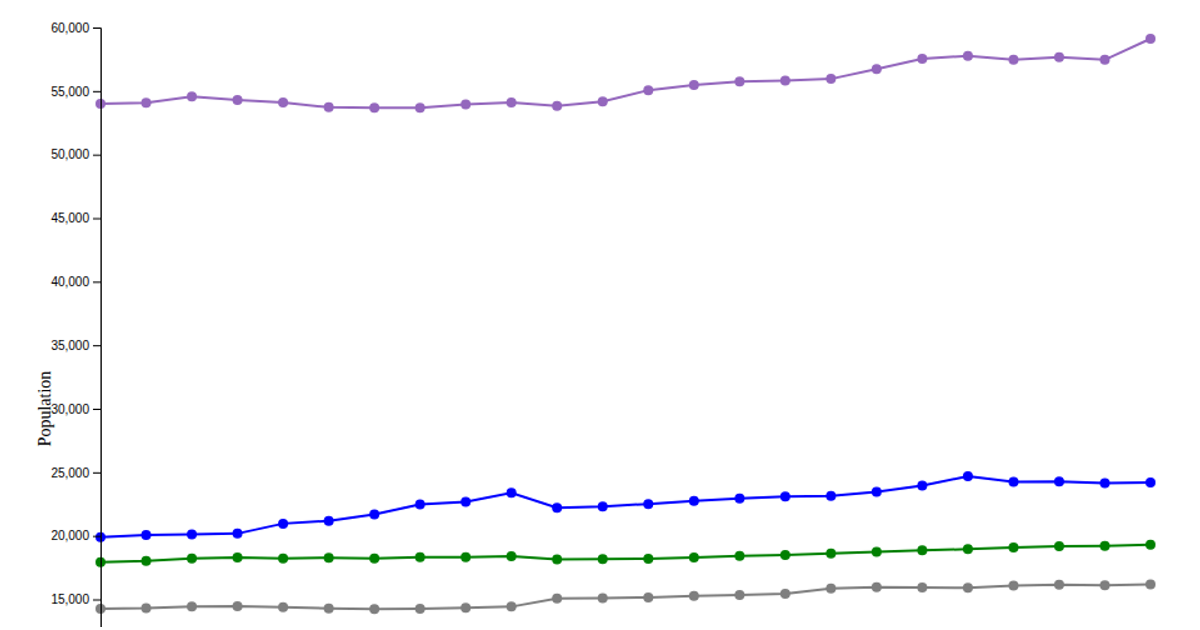
This visualization displays the population of Cohasset, Massachusetts from 2000 to 2023, sourced from Neil S. Berg’s dataset. It uses a line chart with circle markers to highlight yearly population values, revealing a significant rise in 2011 and a drop in 2020 likely due to COVID. Built with React, it employs D3 v7’s `scaleLinear`, `line`, `axisBottom`, and `axisLeft` to render scales, axes, and the line. The data is loaded from a CSV file and formatted by `d3.csv` before being passed to the custom `viz` function.
AI-generated descriptionhttps://www.neilsberg.com/insights/cohasset-ma-population-by-year/ I found this dataset by searching https://datasetsearch.research.google.com
It shows the population of the town Cohasset MA each year and how much it changes by.
The notable changes are in 2010 when 500 new people moves in and in 2020 where there was a drop in population, presumably due to COVID.




Comments
Sign in to join the discussion.