🌍 Public
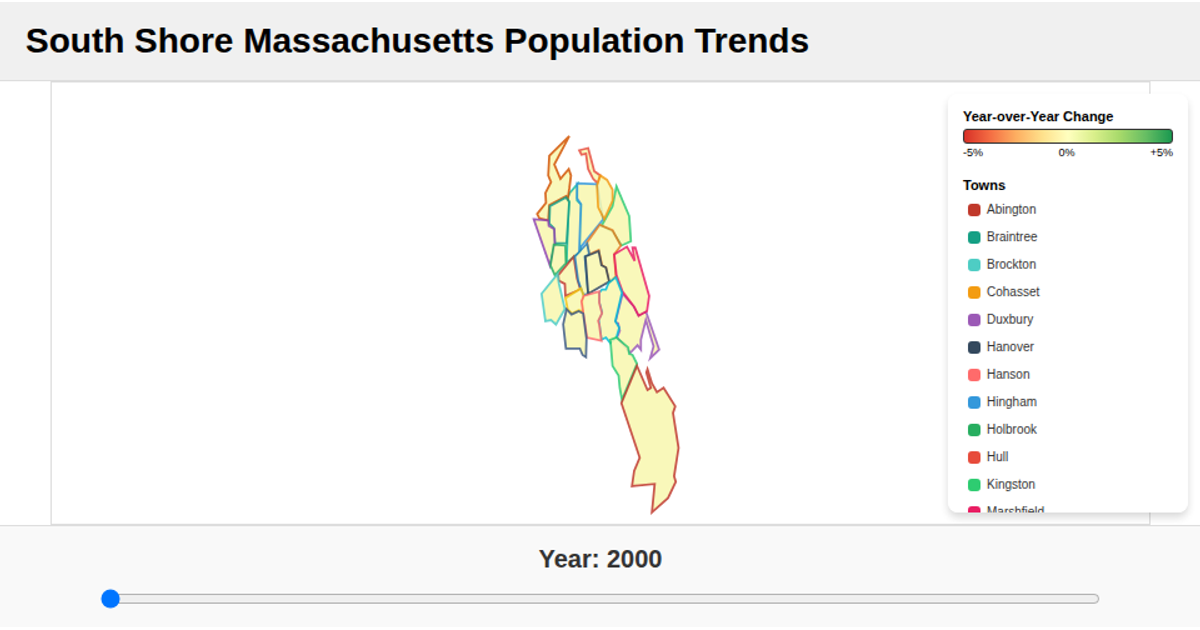
Boxes Population of Towns on the South Shore Of MA
SSean Thornton
Last edited Oct 7, 2025
Created on Oct 7, 2025
Forked from Map Population of Towns on the South Shore Of MA
A grid of color-coded squares displays the population of eight Massachusetts South Shore towns for a selected year, with each square showing the population, annual percent change, and town name. The fill color maps from red to green based on percent change, using the D3 `interpolateRdYlGn` color scale with a legend. A slider updates the displayed year, re-rendering the visualization with data from CSV files loaded via D3's `csv` module, and the React app manages the state.
AI-generated descriptionMIT Licensed



Comments
Sign in to join the discussion.