🌍 Public
D3 - Maps
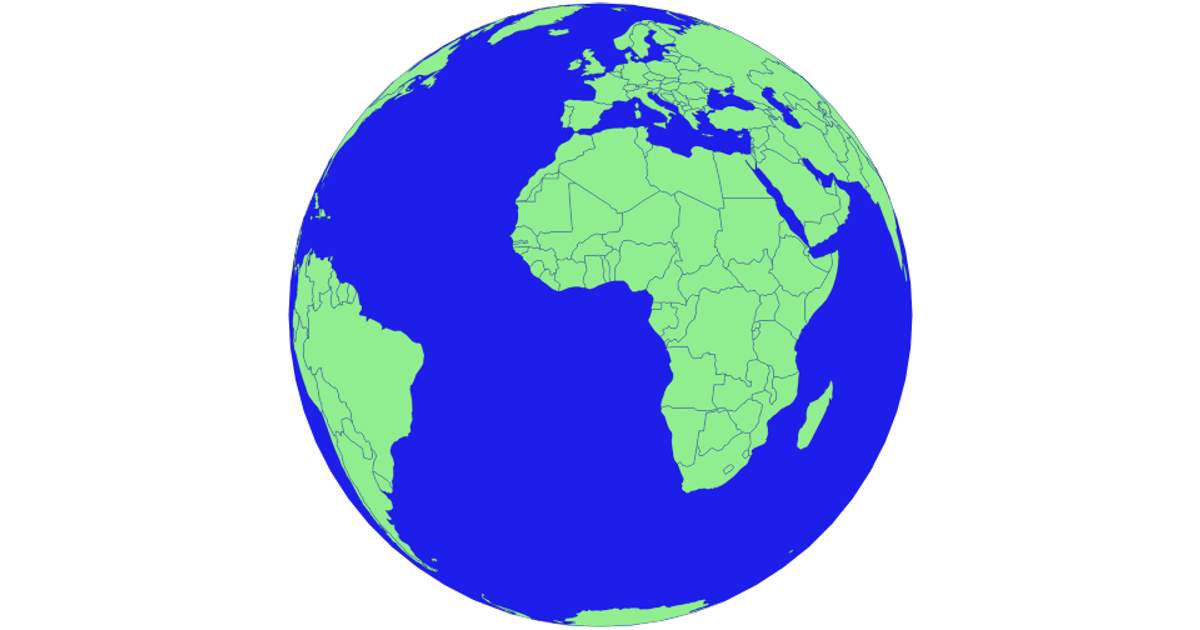
A rotating orthographic globe displays world landmasses as stroked vector outlines on a Canvas element. D3’s `d3.geoOrthographic` projection and `d3.geoPath` render both the geographic features and a graticule, with the rotation updated by `projection.rotate` inside a `setInterval` loop. The geographic data comes from a remote TopoJSON-like GeoJSON file, while the animation runs on a 960×800 canvas.
AI-generated descriptionMIT Licensed


Comments
Sign in to join the discussion.