🌍 Public
Primary Balance on Choropleth Map
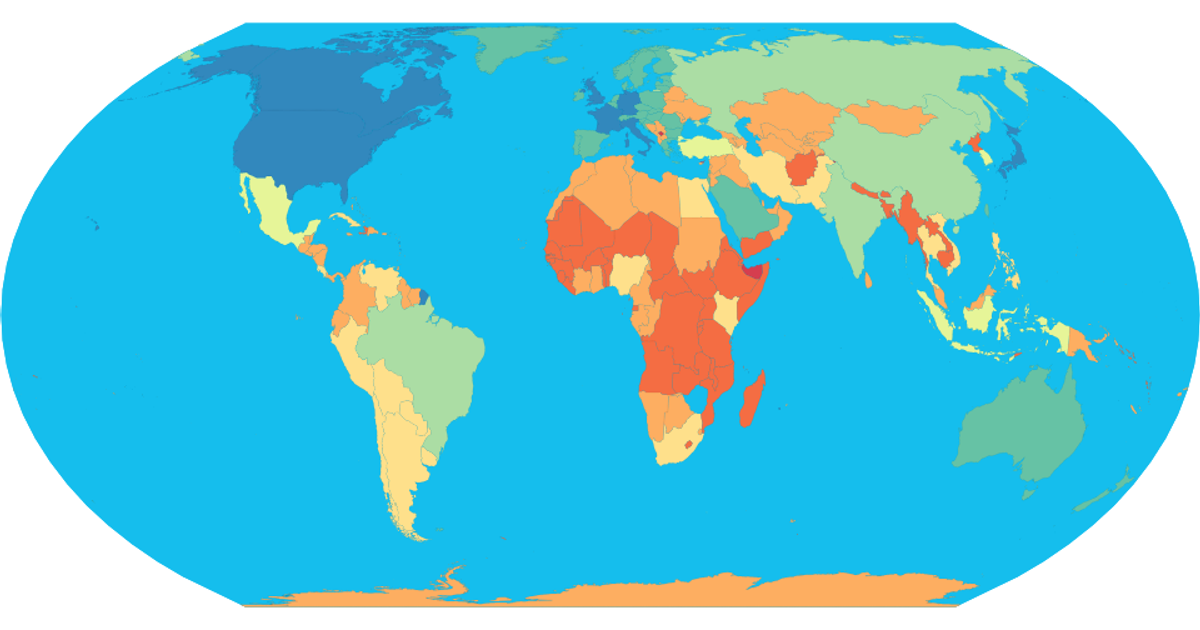
This choropleth map visualizes the primary balance as a percentage of GDP for 55 countries, using color to distinguish values. The map uses an equirectangular projection rendered as SVG paths via d3.geoPath, with data sourced from the IMF. Users can zoom and pan through d3.zoom, and click color legend entries to highlight specific balance ranges. The color scale uses d3.scaleOrdinal and the YlOrRd scheme.
AI-generated descriptionThis visualization shows the Primary Balance (% of GDP) of 55 countries. The dataset comes from the IMF Website.
MIT Licensed



Comments
Sign in to join the discussion.