🌍 Public
Fork of Fork of D3 v5 Sunburst diagram
LLiml
Last edited Apr 5, 2024
Created on Apr 5, 2024
Forked from Fork of D3 v5 Zoomable Sunburst with local json
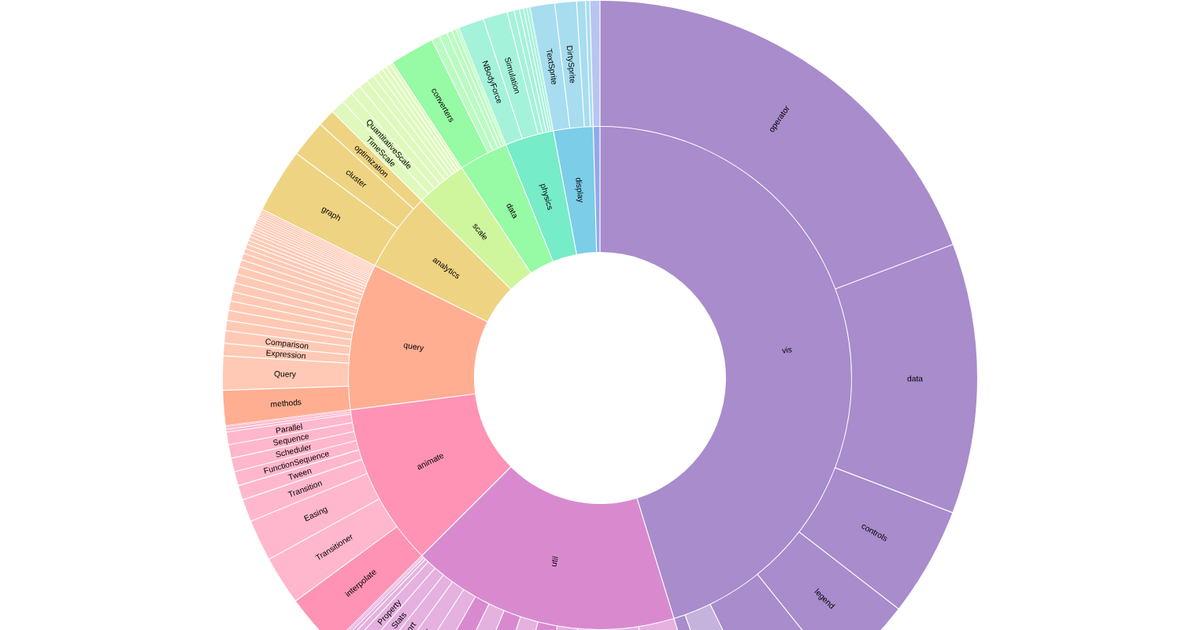
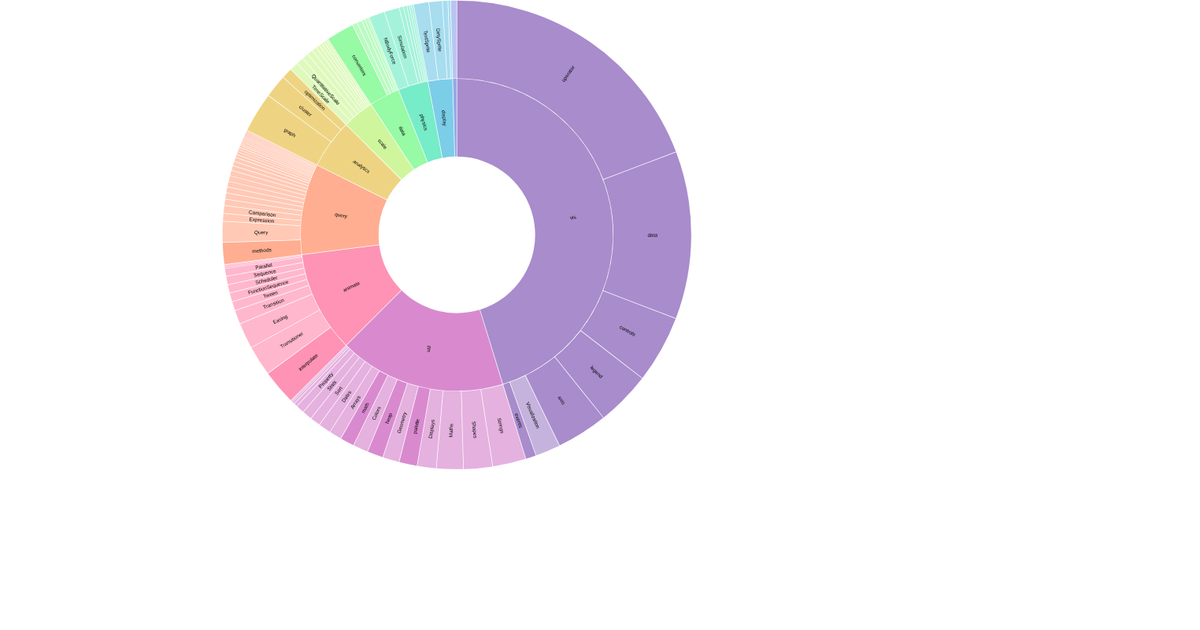
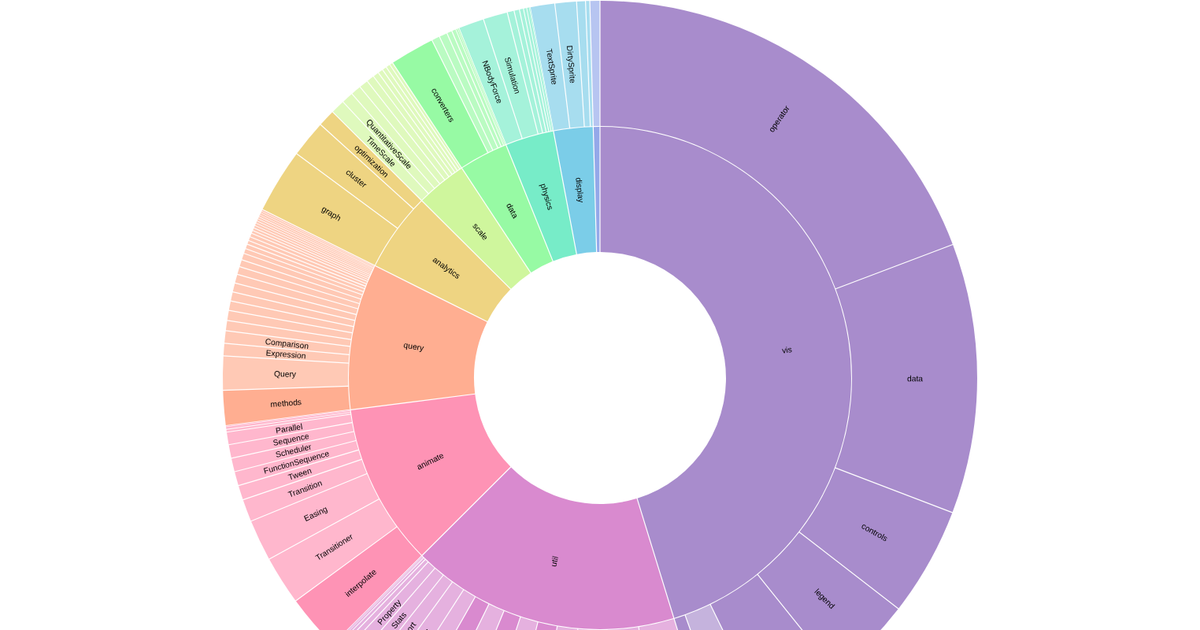
This example shows a static, semi-circular sunburst or donut-style visualization of five categorical values (A–E), displayed as colored arcs radiating from a bottom-center origin. It uses D3 v4’s `d3.pie()` and `d3.arc()` to compute angular segments, with labels placed via `arc.centroid()` and colored using `d3.scaleOrdinal` with the `schemeTableau10` palette. The data is hardcoded as simple values in the script, and the SVG is scaled responsively via a viewBox.
AI-generated descriptionMike Bostock's D3 Zoomable Sunburst example
- with D3 v5 (based on the changes in v5) <br></br> Ported from this Observable notebook for this forum thread. Many thanks to Bryan Gingechen who answered my question about the necessary steps to get from an (Observable) JavaScript notebook to a vanilla JavaScript index.html. He presented his solution on blockbuilder.org
MIT Licensed



Comments
Sign in to join the discussion.