🌍 Public
Fork of D3 v5 Zoomable Sunburst with local json
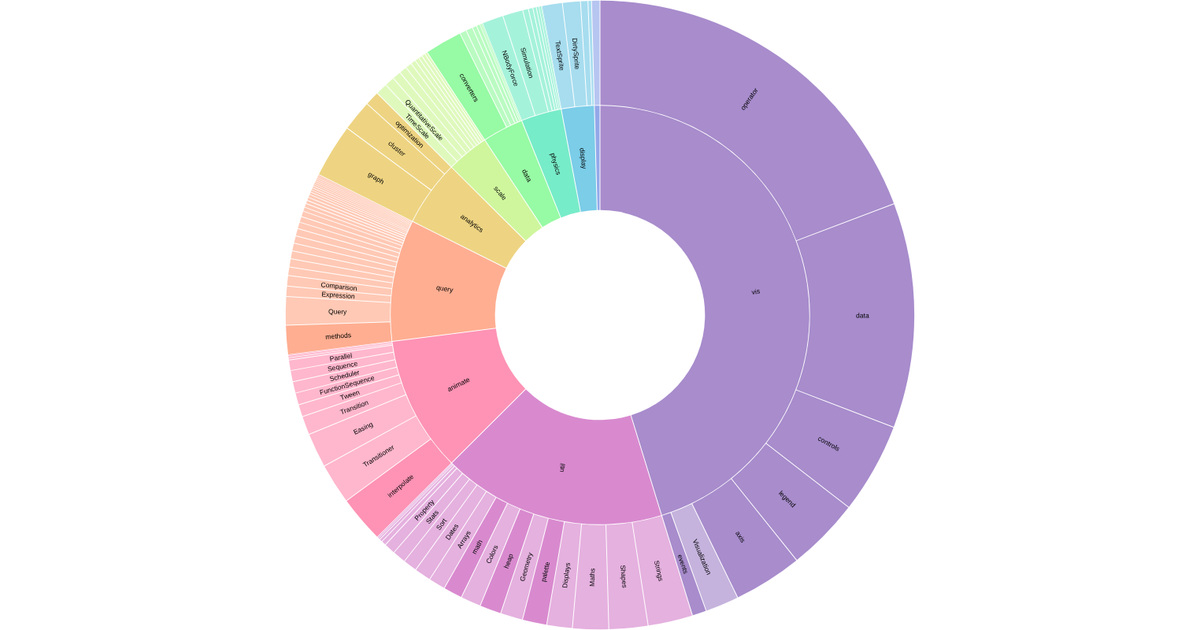
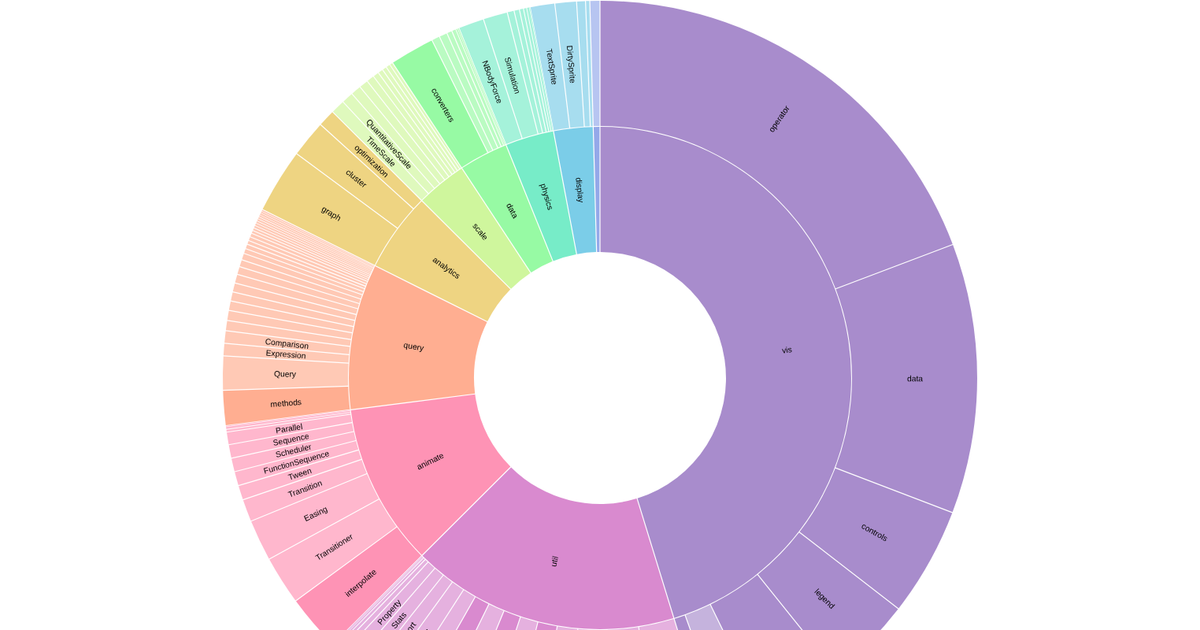
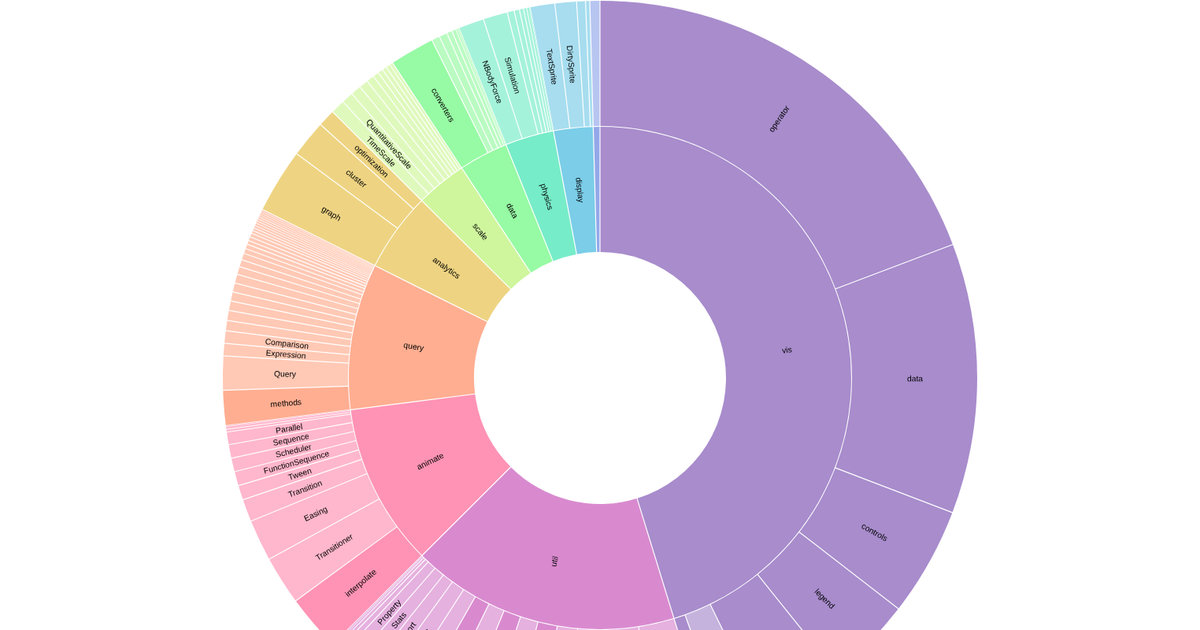
This fork of the D3 zoomable sunburst visualizes the hierarchical flare dataset, displaying nested categories and their values as concentric rings. Users can click arcs to zoom and explore the tree structure. The code uses D3 v5 libraries, including `d3.hierarchy`, `d3.partition`, and `d3.arc`, to generate the interactive graphic. It loads data from a local `flare.json` file and obtains arc color values from the included `styles.css`. The example demonstrates adapting an Observable notebook to a standalone vanilla JavaScript `index.html` file, using methods like `d3.select` and `d3.style` for styling and interaction.
AI-generated descriptionMike Bostock's D3 Zoomable Sunburst example
- with D3 v5 (based on the changes in v5) <br></br> Ported from this Observable notebook for this forum thread. Many thanks to Bryan Gingechen who answered my question about the necessary steps to get from an (Observable) JavaScript notebook to a vanilla JavaScript index.html. He presented his solution on blockbuilder.org
MIT Licensed





Comments
Sign in to join the discussion.