🌍 Public
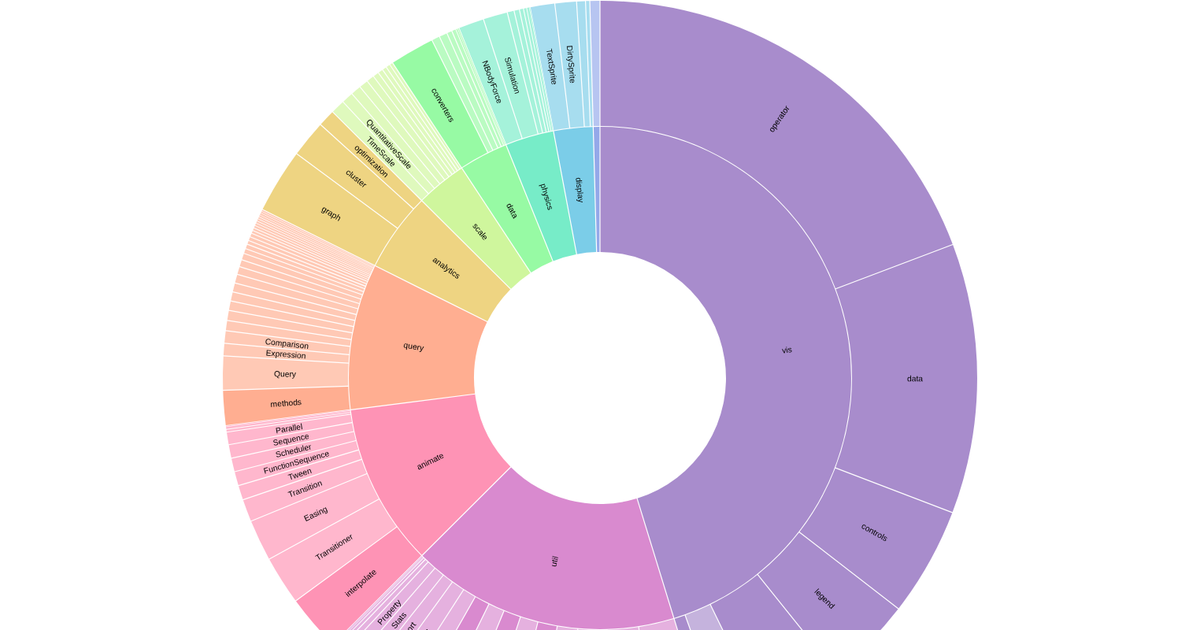
Fork of D3 v5 Zoomable Sunburst
This fork of a D3.js v4 zoomable sunburst chart displays a donut (or pie) diagram built from a static, hard-coded dataset containing five named values. The visualization encodes each categorical value as an arc segment, using a custom ordinal color scale for distinct fills and black strokes with partial opacity for clarity. The implementation relies on the `d3.select`, `d3.pie`, `d3.entries`, `d3.scaleOrdinal`, and `d3.arc` APIs from the D3 v4 library to compute and render the paths inside an SVG container, with a fixed width and height of 450 pixels.
AI-generated descriptionMIT Licensed




Comments
Sign in to join the discussion.