🌍 Public
Bar Graph with D3.js!
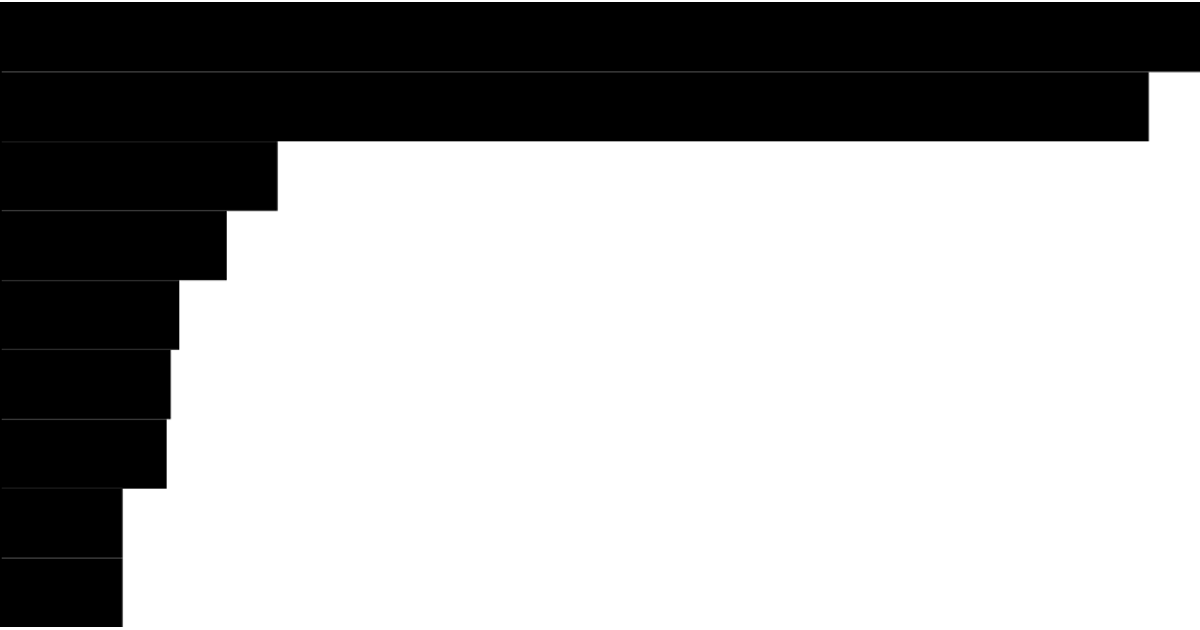
This bar graph displays population counts for nine countries, using horizontal bars scaled linearly from zero to the maximum value. The visualization loads data from a CSV file and renders with D3 v5, employing `d3.scaleLinear` for the x-axis and `d3.scaleBand` for the categorical y-axis. Each country’s population is multiplied by 1,000, and the SVG rectangles are appended directly without axes or labels.
AI-generated descriptionMIT Licensed




Comments
Sign in to join the discussion.